Three story home with an adjacent vacant lot (Residential/Business/General use)
Per Worcester zoning ordinance it is a magnificent opportunity for a company or an investor. Home is located at 10 Cheever St sitting on a 4,800 sq. feet lot and next to it there's a 15,000 sq. feet lot (12 Cheever St.) with 11 garages. Not to be sold separately.
For sale by owner
$1,250,000
10 Cheever St, Worcester, MA 01610
9beds
3,435sqft
MultiFamily
Built in 1905
-- sqft lot
$-- Zestimate®
$364/sqft
$-- HOA
What's special
Three story home
- 3 days
- 78
- 0
Listed by:
Property Owner (508) 762-7248
Facts & features
Interior
Bedrooms & bathrooms
- Bedrooms: 9
- Bathrooms: 3
- Full bathrooms: 3
Heating
- Baseboard, Gas
Appliances
- Included: Dishwasher, Range / Oven, Refrigerator
Features
- Flooring: Carpet, Hardwood, Linoleum / Vinyl
- Basement: Unfinished
Interior area
- Total interior livable area: 3,435 sqft
Property
Parking
- Parking features: Garage - Attached, Off-street
Features
- Exterior features: Other, Shingle, Vinyl, Brick, Cement / Concrete
Lot
- Size: 0.45 Acres
Details
- Parcel number: WORCM07B034L00021
Construction
Type & style
- Home type: MultiFamily
Materials
- brick
- Roof: Shake / Shingle
Condition
- New construction: No
- Year built: 1905
Community & HOA
Location
- Region: Worcester
Financial & listing details
- Price per square foot: $364/sqft
- Tax assessed value: $534,700
- Annual tax amount: $7,053
- Date on market: 10/29/2026
Estimated market value
Not available
Estimated sales range
Not available
$2,146/mo
Price history
| Date | Event | Price |
|---|---|---|
| 10/29/2026 | Listed for sale | $1,250,000-3.8%$364/sqft |
Source: Owner Report a problem | ||
| 9/23/2025 | Listing removed | -- |
Source: Owner Report a problem | ||
| 9/8/2025 | Listed for sale | $1,300,000-13.3%$378/sqft |
Source: Owner Report a problem | ||
| 2/1/2025 | Listing removed | -- |
Source: Owner Report a problem | ||
| 11/4/2024 | Listed for sale | $1,500,000+530.3%$437/sqft |
Source: Owner Report a problem | ||
| 3/3/2017 | Sold | $238,000+58.8%$69/sqft |
Source: Agent Provided Report a problem | ||
| 2/9/2000 | Sold | $149,900$44/sqft |
Source: Agent Provided Report a problem | ||
Public tax history
| Year | Property taxes | Tax assessment |
|---|---|---|
| 2025 | $7,053 +8.5% | $534,700 +13.1% |
| 2024 | $6,500 +4.5% | $472,700 +8.9% |
| 2023 | $6,222 +15% | $433,900 +22% |
| 2022 | $5,409 +13.2% | $355,600 +21.2% |
| 2021 | $4,778 +8.3% | $293,500 +13.1% |
| 2020 | $4,413 +13.2% | $259,600 +19.9% |
| 2019 | $3,897 +2.3% | $216,500 +7.5% |
| 2018 | $3,808 +6.6% | $201,400 +8.3% |
| 2017 | $3,573 +5.2% | $185,900 +12.8% |
| 2016 | $3,397 +2.7% | $164,800 |
| 2015 | $3,308 +2.7% | $164,800 |
| 2014 | $3,220 +4.1% | $164,800 -1% |
| 2013 | $3,092 +6.9% | $166,400 -2.3% |
| 2012 | $2,893 +3.4% | $170,400 -7.7% |
| 2010 | $2,798 -16% | $184,700 -25.2% |
| 2009 | $3,332 -3.3% | $246,800 -10.2% |
| 2008 | $3,447 +4.4% | $274,900 +0.8% |
| 2007 | $3,301 +3.4% | $272,800 +7.1% |
| 2006 | $3,191 +0.8% | $254,700 +6% |
| 2005 | $3,167 +28.6% | $240,300 +43.9% |
| 2004 | $2,463 +14.6% | $167,000 +25.6% |
| 2003 | $2,149 +10.8% | $133,000 +22.5% |
| 2002 | $1,939 +31.9% | $108,600 +36.4% |
| 2000 | $1,470 +18.1% | $79,600 +19.3% |
| 1997 | $1,245 | $66,700 |
Find assessor info on the county website
Monthly payment
Est. payment
Payment breakdown
Explore the cost of this home by adjusting the details. Changes won't be saved.Climate risks
Neighborhood: 01610

Similar homes
- $1,250,0008 bd8 ba5.1k sqft75 Chatham St, Worcester, MA 01609For Sale
 MLS ID #73577324, Ethan Lazar, Horvath & Tremblay. MLS PIN
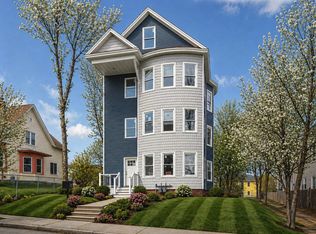
- $949,00012 bd3 ba4.1k sqft39 Gates St, Worcester, MA 01610For Sale
 MLS ID #73588012, Brianna Maggio, eXp Realty LLC. MLS PIN
- $1,150,00011 bd5 ba4.2k sqft484 Park Ave, Worcester, MA 01610For Sale
 MLS ID #73566654, Rubee Hans, Beljen Properties. MLS PIN
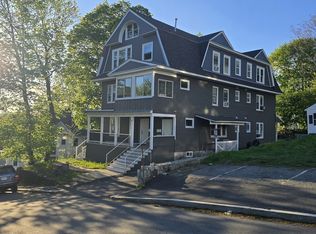
- $1,249,00011 bd7 ba4.3k sqft15 Forestdale Rd, Worcester, MA 01605For Sale
 MLS ID #73518697, Salustia Ortiz, Home For All Realty LLC. MLS PIN
