$--
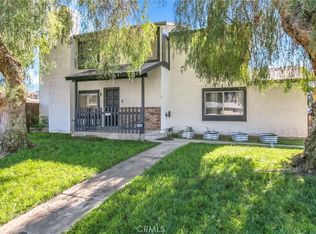
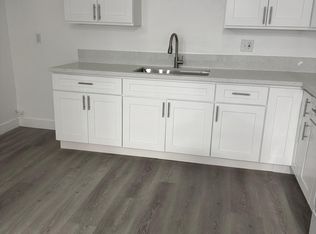
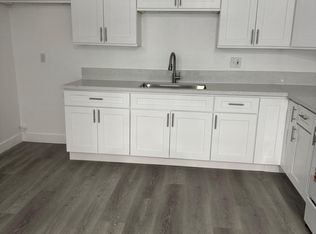
2 bd2 ba1k sqft
1007 Lombard Dr #D, Redlands, CA 92374
Off Market
Likely to sell faster than
Zillow last checked:
Listing updated:
Cristian Camargo DRE #02052757 949-903-5702,
Realty ONE Group Homelink
 Originating MLS: California Regional MLS
$1,212,900
$1.15M - $1.27M
$2,432/mo
| Date | Event | Price |
|---|---|---|
| 10/13/2026 | Listed for sale | $1,250,000+54.3%$287/sqft |
Source:  CRMLS #IG26222570 Report a problem | ||
| 4/22/2021 | Sold | $810,000+58.8%$186/sqft |
Source: Public Record Report a problem | ||
| 2/29/2016 | Sold | $510,000+19.7%$117/sqft |
Source: Public Record Report a problem | ||
| 4/25/2014 | Sold | $426,000-2.1%$98/sqft |
Source: Public Record Report a problem | ||
| 2/16/2014 | Listed for sale | $435,000+77.6%$100/sqft |
Source: Dw Investments #NP14032394 Report a problem | ||
| 1/17/2012 | Sold | $245,000-0.6%$56/sqft |
Source: Public Record Report a problem | ||
| 8/9/2011 | Sold | $246,600-49.7%$57/sqft |
Source: Public Record Report a problem | ||
| 10/1/2004 | Sold | $490,000+44.1%$112/sqft |
Source: Public Record Report a problem | ||
| 11/26/2003 | Sold | $340,000+29.2%$78/sqft |
Source: Public Record Report a problem | ||
| 4/8/2003 | Sold | $263,200+19.6%$60/sqft |
Source: Public Record Report a problem | ||
| 10/5/2001 | Sold | $220,000+57.1%$50/sqft |
Source: Public Record Report a problem | ||
| 9/18/2000 | Sold | $140,000-6%$32/sqft |
Source: Public Record Report a problem | ||
| 3/29/2000 | Sold | $149,000-50.3%$34/sqft |
Source: Public Record Report a problem | ||
| 4/9/1999 | Sold | $300,000+140%$69/sqft |
Source: Public Record Report a problem | ||
| 10/16/1997 | Sold | $125,000+4.2%$29/sqft |
Source: Public Record Report a problem | ||
| 3/15/1996 | Sold | $120,000$28/sqft |
Source: Public Record Report a problem | ||
| Year | Property taxes | Tax assessment |
|---|---|---|
| 2026 | -- | $894,307 +2% |
| 2025 | $10,947 +7.1% | $876,771 +2% |
| 2024 | $10,222 +0.1% | $859,579 +2% |
| 2023 | $10,210 +1.5% | $842,724 +2% |
| 2022 | $10,063 +25.3% | $826,200 +30.6% |
| 2021 | $8,028 +1.5% | $632,506 +1% |
| 2020 | $7,910 +16.4% | $626,020 +15.7% |
| 2019 | $6,796 +2.5% | $541,217 +2% |
| 2018 | $6,628 +0.8% | $530,604 +2% |
| 2017 | $6,573 | $520,200 +17.9% |
| 2016 | $6,573 +16.6% | $441,138 +1.5% |
| 2015 | $5,638 +0.7% | $434,511 +73.1% |
| 2014 | $5,597 | $251,034 +0.5% |
| 2013 | -- | $249,900 -65.5% |
| 2012 | -- | $723,518 +2% |
| 2011 | -- | $709,331 +0.8% |
| 2010 | -- | $704,030 -0.2% |
| 2009 | -- | $705,702 +2% |
| 2008 | -- | $691,864 +2% |
| 2007 | -- | $678,298 +35.7% |
| 2006 | -- | $499,800 +2% |
| 2005 | -- | $490,000 +44.1% |
| 2004 | -- | $340,000 +51.5% |
| 2003 | -- | $224,400 +2% |
| 2002 | -- | $220,000 +37.5% |
| 2001 | -- | $160,000 -47.7% |
| 2000 | -- | $306,000 |


A local agent can set up tours, give advice and negotiate with sellers.