$--
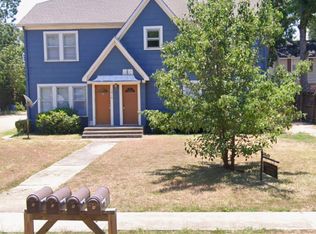
1 bd|1 ba|700 sqft
1010 Maple St APT A, Kilgore, TX 75662
Off Market
Zillow last checked:
Listing updated:
Julie Woods 903-587-5373,
Julie Woods & Associates - Longview
$269,400
$256,000 - $283,000
$1,038/mo
| Date | Event | Price |
|---|---|---|
| 5/28/2026 | Price change | $275,000-1.8%$356/sqft |
Source: | ||
| 4/6/2026 | Listed for sale | $280,000+30.2%$362/sqft |
Source: | ||
| 5/17/2022 | Sold | -- |
Source: | ||
| 4/13/2022 | Price change | $215,000+7.8%$278/sqft |
Source: | ||
| 4/7/2022 | Listed for sale | $199,500-9.3%$258/sqft |
Source: | ||
| 2/3/2022 | Listing removed | -- |
Source: | ||
| 12/22/2021 | Price change | $220,000-2.2%$285/sqft |
Source: | ||
| 12/2/2021 | Listed for sale | $225,000$291/sqft |
Source: | ||
| 12/1/2021 | Listing removed | -- |
Source: | ||
| 7/2/2021 | Price change | $225,000-4.3%$291/sqft |
Source: | ||
| 5/10/2021 | Listed for sale | $235,000+104.5%$304/sqft |
Source: | ||
| 12/30/2019 | Sold | -- |
Source: | ||
| 11/8/2019 | Listed for sale | $114,900$149/sqft |
Source: RELIABLE REAL ESTATE #20196093 Report a problem | ||
| 3/20/2018 | Listing removed | $595$1/sqft |
Source: Zillow Rental Manager Report a problem | ||
| 10/30/2017 | Listed for rent | $595+20.2%$1/sqft |
Source: Zillow Rental Manager Report a problem | ||
| 9/7/2017 | Listing removed | $495$1/sqft |
Source: Zillow Rental Manager Report a problem | ||
| 8/8/2017 | Listed for rent | $495+6.5%$1/sqft |
Source: Zillow Rental Manager Report a problem | ||
| 6/15/2017 | Listing removed | $465$1/sqft |
Source: Zillow Rental Manager Report a problem | ||
| 3/3/2017 | Price change | $465-21.8%$1/sqft |
Source: Zillow Rental Manager Report a problem | ||
| 1/23/2017 | Listed for rent | $595$1/sqft |
Source: Zillow Rental Manager Report a problem | ||
| Year | Property taxes | Tax assessment |
|---|---|---|
| 2025 | $5,726 +13.1% | $254,190 +13% |
| 2024 | $5,062 +14.4% | $225,040 +12.9% |
| 2023 | $4,424 +39.1% | $199,320 +53% |
| 2022 | $3,181 +51.3% | $130,310 +42.2% |
| 2021 | $2,102 +35.9% | $91,630 +30.5% |
| 2020 | $1,546 -0.6% | $70,220 |
| 2019 | $1,556 +19.1% | $70,220 +22.9% |
| 2018 | $1,306 | $57,140 |
| 2017 | $1,306 +1.5% | $57,140 |
| 2016 | $1,287 +1.5% | $57,140 |
| 2015 | $1,268 | $57,140 |
| 2014 | -- | $57,140 |
| 2013 | -- | $57,140 +0.8% |
| 2012 | -- | $56,690 -7.5% |
| 2011 | -- | $61,290 +2.7% |
| 2010 | -- | $59,700 -54.4% |
| 2009 | -- | $130,890 +0.4% |
| 2008 | -- | $130,420 +11.5% |
| 2007 | -- | $116,980 |
| 2006 | -- | $116,980 +0.7% |
| 2005 | -- | $116,200 -2.2% |
| 2004 | -- | $118,860 +14.2% |
| 2003 | -- | $104,050 +0.1% |
| 2002 | -- | $103,980 +5.1% |
| 2001 | -- | $98,970 +3% |
| 2000 | -- | $96,100 |
Find assessor info on the county website
Source: GTARMLS. This data may not be complete. We recommend contacting the local school district to confirm school assignments for this home.
A local agent can set up tours, give advice and negotiate with sellers.
A local lender can help you make sure your offer is ready when you are.