Off-Market Ranch home. 3 bed 1 bath with detached shed/garage. New windows, flooring, siding and 5 year old roof. Walk-in bathtub. Great first home opportunity or senior living with potential to enhance value with additional TLC.
Asking $170k OBO also willing to use network for any additional renovation.
For sale by owner
$170,000
1015 Garfield Ave, Lancaster, OH 43130
3beds
1,140sqft
SingleFamily
Built in 1960
6,499 Square Feet Lot
$-- Zestimate®
$149/sqft
$-- HOA
What's special
Walk-in bathtubNew windows
- 30 days
- 1,052
- 62
Listed by:
Property Owner (252) 532-5477
Facts & features
Interior
Bedrooms & bathrooms
- Bedrooms: 3
- Bathrooms: 1
- Full bathrooms: 1
Heating
- Other
Cooling
- Central
Interior area
- Total interior livable area: 1,140 sqft
Property
Parking
- Parking features: Garage - Detached
Features
- Exterior features: Wood
Lot
- Size: 6,499 Square Feet
Details
- Parcel number: 0531092000
Construction
Type & style
- Home type: SingleFamily
Materials
- Frame
Condition
- New construction: No
- Year built: 1960
Community & HOA
Location
- Region: Lancaster
Financial & listing details
- Price per square foot: $149/sqft
- Tax assessed value: $178,380
- Annual tax amount: $2,362
- Date on market: 9/18/2026
Estimated market value
Not available
Estimated sales range
Not available
$1,421/mo
Price history
| Date | Event | Price |
|---|---|---|
| 9/18/2026 | Listed for sale | $170,000+100%$149/sqft |
Source: Owner Report a problem | ||
| 8/5/2026 | Sold | $85,000+20.6%$75/sqft |
Source: Public Record Report a problem | ||
| 1/7/2011 | Sold | $70,500-4.1%$62/sqft |
Source: Public Record Report a problem | ||
| 8/4/2010 | Listed for sale | $73,500$64/sqft |
Source: Visual Tour #9911668 Report a problem | ||
Public tax history
| Year | Property taxes | Tax assessment |
|---|---|---|
| 2025 | $2,362 +44% | $62,430 +59.2% |
| 2024 | $1,640 +10.4% | $39,220 |
| 2023 | $1,485 +2.1% | $39,220 |
| 2022 | $1,454 +22.4% | $39,220 +31% |
| 2021 | $1,188 -0.5% | $29,930 |
| 2020 | $1,194 +10.2% | $29,930 |
| 2019 | $1,084 +22.7% | $29,930 +21.9% |
| 2018 | $883 -0.1% | $24,550 +4.7% |
| 2017 | $884 +3.5% | $23,450 |
| 2016 | $854 -3.2% | $23,450 -0.3% |
| 2015 | $883 +5% | $23,520 |
| 2014 | $841 +0.5% | $23,520 |
| 2013 | $837 +0.9% | $23,520 |
| 2012 | $829 +176.4% | $23,520 -5.6% |
| 2011 | $300 +3.1% | $24,910 |
| 2010 | $291 -7% | $24,910 -5% |
| 2009 | $313 +7.2% | $26,210 0% |
| 2008 | $292 -0.2% | $26,215 |
| 2007 | $292 -14.7% | $26,215 +10.1% |
| 2006 | $343 -2.2% | $23,804 |
| 2005 | $351 -28.6% | $23,804 |
| 2004 | $491 +12.4% | $23,804 +1.2% |
| 2003 | $437 -2.2% | $23,513 |
| 2002 | $447 -2% | $23,513 |
| 2001 | $456 +20.3% | $23,513 +24.1% |
| 2000 | $378 | $18,946 |
Find assessor info on the county website
Monthly payment
Est. payment
Payment breakdown
Explore the cost of this home by adjusting the details. Changes won't be saved.Climate risks
Neighborhood: 43130

Similar homes
- $174,9003 bd1 ba916 sqft312 Hunter Ave, Lancaster, OH 43130For Sale
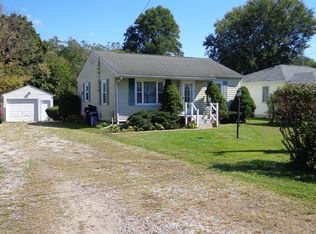
 MLS ID #226036934, Dean Bradford, Howard HannaRealEstateServices. Columbus and Central Ohio Regional MLS
- $169,0003 bd2 ba1.1k sqft327 Harrison Ave, Lancaster, OH 43130For Sale
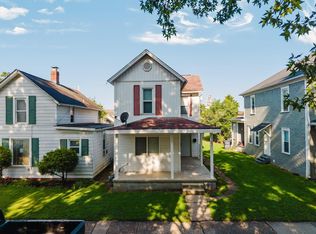 MLS ID #226032512, Jinqiao Li, B.O.S.S. Realty Group. Columbus and Central Ohio Regional MLS
- $215,0003 bd1 ba1.1k sqft450 Shoshone Dr, Lancaster, OH 43130For Sale
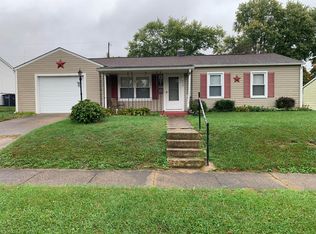 MLS ID #226039577, Stephanie L Conrad, Red 1 Realty. Columbus and Central Ohio Regional MLS
- $160,0002 bd1 ba882 sqft1622 W Fair Ave, Lancaster, OH 43130For Sale
 MLS ID #226038745, Megan L Bell, Real of Ohio. Columbus and Central Ohio Regional MLS
- $169,9002 bd1 ba952 sqft120 Maud Ave, Lancaster, OH 43130For SaleMLS ID #226028869, Alessandra Hoop, Century 21 Darfus Realty. Columbus and Central Ohio Regional MLS
- $200,0003 bd1 ba1.3k sqft539 Frederick St N, Lancaster, OH 43130For SaleMLS ID #226038632, Kiya Leah Catherine White, Rise Realty. Columbus and Central Ohio Regional MLS
- $179,9003 bd1 ba916 sqft741 Cherokee Dr, Lancaster, OH 43130For SaleMLS ID #226024333, Amy Wright, SAYRE SEALS & MCMILLAN REAL ESTATE LLC. Columbus and Central Ohio Regional MLS
- $204,9003 bd2 ba1.1k sqft624 Harrison Ave, Lancaster, OH 43130For SaleMLS ID #226035442, Sherrell Erica Butler, e-Merge Real Estate. Columbus and Central Ohio Regional MLS
- $179,9002 bd1 ba1k sqft133 Arney Ave, Lancaster, OH 43130For SaleMLS ID #226029447, Robert M Panian, e-Merge Real Estate. Columbus and Central Ohio Regional MLS
- $144,9003 bd1 ba1k sqft539 E Walnut St, Lancaster, OH 43130For SaleMLS ID #226038780, Bridget Almashy, Red 1 Realty. Columbus and Central Ohio Regional MLS
- $150,0003 bd2 ba1.4k sqft632 Frederick St, Lancaster, OH 43130For SaleMLS ID #226025149, Joan Elflein, Ohio Broker Direct, LLC. Columbus and Central Ohio Regional MLS
- $224,8883 bd2 ba1.1k sqft832 E Main St, Lancaster, OH 43130For SaleMLS ID #226039603, Roger Downour, Rise Realty. Columbus and Central Ohio Regional MLS
- $184,9002 bd1 ba903 sqft412 Garfield Ave, Lancaster, OH 43130For SaleMLS ID #226030165, Jill Covey, Rock House Realty LLC. Columbus and Central Ohio Regional MLS
- $225,0003 bd2 ba1.6k sqft1144 Sugar Grove Rd SE, Lancaster, OH 43130For SaleMLS ID #226038411, Alyson Hartung, Coldwell Banker Realty. Columbus and Central Ohio Regional MLS
- $199,9902 bd1 ba1k sqft417 Washington Ave, Lancaster, OH 43130For SaleMLS ID #226031327, Ashley M Moore, RE/MAX Revealty. Columbus and Central Ohio Regional MLS
- $249,9002 bd2 ba936 sqft1721 Glenmar Dr, Lancaster, OH 43130For SaleMLS ID #226038399, Kelly Abbott, Howard Hanna Real Estate Svcs. Columbus and Central Ohio Regional MLS
- $218,8003 bd2 ba1.1k sqft838 E Main St, Lancaster, OH 43130For SaleMLS ID #226038204, Roger Downour, Rise Realty. Columbus and Central Ohio Regional MLS
- $224,9002 bd1 ba1.1k sqft950 N Pierce Ave, Lancaster, OH 43130For SaleMLS ID #226024238, Johnelle E Baker, Coldwell Banker Realty. Columbus and Central Ohio Regional MLS
- $249,9003 bd1 ba1.2k sqft230 Williamsburg Ln, Lancaster, OH 43130For SaleMLS ID #226038064, Lauren DeLeon, Keller Williams Greater Cols. Columbus and Central Ohio Regional MLS
- $199,9002 bd1 ba1.1k sqft645 E Mulberry St, Lancaster, OH 43130For SaleMLS ID #226034455, Bryan Robert Schoonover, Signature Real Estate. Columbus and Central Ohio Regional MLS
