Ready for your new home. Manufactured allowed. 2 water wells, city water, septic already in place. Lot cleared and cleaned up. Ready for immediate use. Nice trees, quiet street. Rare find.
Active under contract
$184,999
1030 Neal Rd, San Antonio, TX 78264
--beds
--baths
4.36Acres
Unimproved Land
Built in ----
4.36 Acres Lot
$-- Zestimate®
$87/sqft
$-- HOA
What's special
Nice treesQuiet street
- 33 days
- 571
- 64
Likely to sell faster than
Zillow last checked:
Listing updated:
Listed by:
Erik Saengerhausen (210)439-4471,
Erik Saengerhausen, Broker
Source: Central Texas MLS,MLS#: 626273 Originating MLS: Four Rivers Association of REALTORS
Facts & features
Interior
Interior area
- Total interior livable area: 2,128 sqft
Video & virtual tour
Property
Features
- Fencing: None
- View description: None
- Body of water: None
Lot
- Size: 4.36 Acres
Details
- Parcel number: 041810000310
- Zoning description: residential
Utilities & green energy
- Sewer: Public Sewer, Septic Tank
- Water: Public, Private, Well
- Utilities for property: Water Available
Community & HOA
Community
- Features: None
HOA
- Has HOA: No
Location
- Region: San Antonio
Financial & listing details
- Price per square foot: $87/sqft
- Tax assessed value: $172,000
- Date on market: 9/25/2026
- Cumulative days on market: 34 days
- Listing agreement: Exclusive Right To Sell
- Listing terms: Cash,Conventional
- Road surface type: Asphalt
Estimated market value
Not available
Estimated sales range
Not available
Not available
Price history
| Date | Event | Price |
|---|---|---|
| 10/24/2026 | Contingent | $184,999$87/sqft |
Source:  Central Texas MLS #626273 Report a problem | ||
| 9/25/2026 | Listed for sale | $184,999$87/sqft |
Source: Central Texas MLS #626273 Report a problem | ||
Public tax history
| Year | Property taxes | Tax assessment |
|---|---|---|
| 2026 | -- | $172,000 +24.5% |
| 2025 | $303 +17.3% | $138,182 +10% |
| 2024 | $259 -11.5% | $125,620 +10% |
| 2023 | $292 -37.7% | $114,200 +10% |
| 2022 | $469 -5% | $103,818 +10% |
| 2021 | $494 | $94,380 +10% |
| 2020 | $494 +6.5% | $85,800 +10% |
| 2019 | $464 | $78,000 +1.3% |
| 2018 | $464 -9% | $77,000 +10% |
| 2017 | $509 +10.5% | $70,000 +9.4% |
| 2016 | $461 -21.2% | $64,000 -1.4% |
| 2015 | $585 | $64,920 +5.6% |
| 2014 | $585 | $61,490 -4.3% |
| 2013 | -- | $64,240 +2.8% |
| 2012 | -- | $62,490 -1.9% |
| 2011 | -- | $63,680 -2.5% |
| 2010 | -- | $65,340 -9.4% |
| 2009 | -- | $72,150 +31.2% |
| 2008 | -- | $55,000 +4.2% |
| 2007 | -- | $52,800 +6.7% |
| 2005 | -- | $49,480 |
| 2004 | -- | -- |
| 2003 | -- | -- |
| 2002 | -- | -- |
| 2001 | -- | -- |
| 2000 | -- | -- |
Find assessor info on the county website
Monthly payment
Climate risks
Neighborhood: 78264
Nearby schools
Schools provided by the listing agent
- District: Southside ISD
Source: Central Texas MLS. This data may not be complete. We recommend contacting the local school district to confirm school assignments for this home.
Similar homes
- $200,0002.5 acres24760 Open Range Rd LOT 11, San Antonio, TX 78264Lot/Land

 MLS ID #2025758, Mike Gutierrez TREC #733782, Stetsn Real Estate. LERA MLS
- $250,0005 acres00 Trumbo LOT 123, San Antonio, TX 78264Lot/Land
 MLS ID #2014778, Maria Gonzalez TREC #715995, San Antonio Elite Realty. LERA MLS
- $225,00010.02 acresTBD W Jett Rd, San Antonio, TX 78264Lot/Land
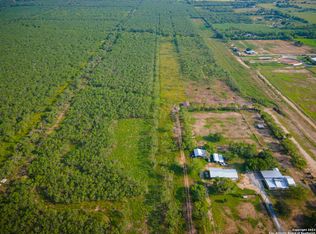 MLS ID #1830051, Sean Blanchard TREC #628118, Becker Properties, LLC. LERA MLS
- $210,0004.26 acres10331 Moursund LOT P-12A, San Antonio, TX 78221Lot/Land
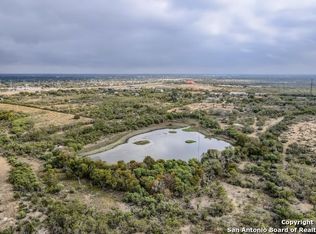 MLS ID #1924869, Stephanie Muhlenfeld TREC #840182, LPT Realty, LLC. LERA MLS
- $150,0002.44 acres3398 S LOOP 1604 E LOT 214, San Antonio, TX 78264Lot/LandMLS ID #2008358, Beatrice Briseno TREC #443893, RE/MAX Unlimited. LERA MLS
- $210,0003.23 acres2572 Mogford Rd LOT 36, San Antonio, TX 78264Lot/LandMLS ID #2005874, Christopher Watters TREC #567369, Watters International Realty. LERA MLS
- $229,9003.12 acres1510 SPUR RDG LOT 48, San Antonio, TX 78264Lot/LandMLS ID #2010970, Arianne Villanueva TREC #733919, Teifke Real Estate. LERA MLS
- $200,0006.9 acresTBD Pleasanton Road LOT 1526, San Antonio, TX 78264Lot/LandMLS ID #1928680, Martha Salinas TREC #683686, Keller Williams City-View. LERA MLS
- $155,9972.65 acres1903 Turkey Chase LOT 390, San Antonio, TX 78264Lot/LandMLS ID #2008085, Shana Kounse TREC #635872, Keller Williams Heritage. LERA MLS
- $160,0008.4 acresTRACT A S TRACT A S Loop 1604 E LOT 2016, San Antonio, TX 78264Lot/LandMLS ID #2000859, Juan Solis TREC #780415, Real Broker, LLC. LERA MLS
- $199,9004.27 acres5747 HIGDON RD LOT 231, San Antonio, TX 78223Lot/LandMLS ID #2021458, Cathy Thomas TREC #751034, IH 10 Realty. LERA MLS
- $169,9003.25 acres25600 Campbellton LOT 114, San Antonio, TX 78264Lot/LandMLS ID #1881459, Nina Lawson TREC #591312, San Antonio's Finest Realty. LERA MLS
- $250,00011.1 acresTBD Smith Rd LOT 6, Somerset, TX 78069Lot/LandMLS ID #2026718, Hector Ramirez TREC #720089, Real Broker, LLC. LERA MLS
- $179,9001.27 acres560 S Loop 1604 E LOT MID, San Antonio, TX 78264Lot/LandMLS ID #2009765, Ameen Aziz TREC #641394, Citywide Realty, LLC. LERA MLS
- $123,0004.98 acresTRACT 4 1580 Hickory Lane LOT 4, San Antonio, TX 78264Lot/LandMLS ID #1931912, Devin Resendez TREC #663042, Keller Williams Legacy. LERA MLS
- $155,0006.72 acres- Trumbo Road LOT 01334, San Antonio, TX 78065Lot/LandMLS ID #1952369, Jacqueline Elizalde TREC #727212, LPT Realty, LLC. LERA MLS
- $150,0002.15 acres4347 COMMERCIAL AVE LOT 318, San Antonio, TX 78221Lot/LandMLS ID #2004185, Sandra Figueroa TREC #829334, M Effect Realty. LERA MLS
- $235,0004.3 acres13407 Henze LOT 451, San Antonio, TX 78223Lot/LandMLS ID #1927448, Rita Hubner TREC #615217, Premier Realty Group Platinum. LERA MLS
