The Columbus Rental Portfolio is a 72-unit residential portfolio across the Columbus, GA market. Priced at approximately $64,000 per unit, the portfolio sits well below replacement cost, providing capital preservation and long term value potential. The portfolio features a diverse mix of single family homes, duplexes, triplexes, and small multifamily units with 97% occupancy and professional management, delivering immediate cash flow. Many units have been renovated, limiting near-term capital needs, while remaining units offer operational upside and mark to market rent potential. Strong workforce demand in Columbus, driven by military, healthcare, and service sector employment, supports stable occupancy and rental growth. This portfolio offers investors scaled exposure, durable income, and long term value creation in a resilient Southeast rental market.
For sale
$4,661,500
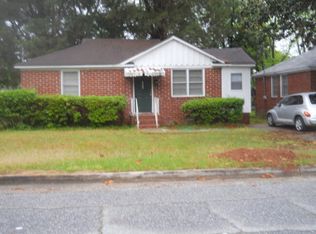
1035 Fisk Ave, Columbus, GA 31906
--beds
--baths
792sqft
Multi Family
Built in 1950
-- sqft lot
$-- Zestimate®
$5,886/sqft
$-- HOA
What's special
- 134 days |
- 166 |
- 1 |
Zillow last checked:
Listing updated:
Listed by:
Ashley Wheeler 434-962-1578,
G2 Commercial Real Estate
Source: CBORGA,MLS#: 228041
Loading...
Facts & features
Interior
Interior area
- Total structure area: 792
- Total interior livable area: 792 sqft
Property
Lot
- Size: 4,791 Square Feet
Details
- Parcel number: 051014006
Construction
Type & style
- Home type: MultiFamily
- Property subtype: Multi Family
Condition
- 76 Years
- New construction: No
- Year built: 1950
Utilities & green energy
- Utilities for property: Electricity Available, Natural Gas Available, Phone Available, Sewer Available, Water Available
Community & HOA
Community
- Security: None
Location
- Region: Columbus
Financial & listing details
- Price per square foot: $5,886/sqft
- Tax assessed value: $62,640
- Date on market: 2/18/2026
- Electric utility on property: Yes
Estimated market value
Not available
Estimated sales range
Not available
Not available
Price history
| Date | Event | Price |
|---|---|---|
| 2/18/2026 | Listed for sale | $4,661,500+51694.4%$5,886/sqft |
Source: | ||
| 1/19/2026 | Listing removed | $750$1/sqft |
Source: Zillow Rentals Report a problem | ||
| 1/12/2026 | Price change | $750-3.2%$1/sqft |
Source: Zillow Rentals Report a problem | ||
| 12/11/2025 | Price change | $775-2.5%$1/sqft |
Source: Zillow Rentals Report a problem | ||
| 9/5/2025 | Price change | $795-4.8%$1/sqft |
Source: Zillow Rentals Report a problem | ||
| 7/31/2025 | Price change | $835-1.8%$1/sqft |
Source: Zillow Rentals Report a problem | ||
| 7/16/2025 | Listed for rent | $850+71.7%$1/sqft |
Source: Zillow Rentals Report a problem | ||
| 9/6/2018 | Listing removed | $495$1/sqft |
Source: RENTsmart Property Management, LLC Report a problem | ||
| 7/23/2018 | Listed for rent | $495$1/sqft |
Source: RENTsmart Property Management, LLC Report a problem | ||
| 3/20/2015 | Sold | $9,000$11/sqft |
Source: Public Record Report a problem | ||
Public tax history
| Year | Property taxes | Tax assessment |
|---|---|---|
| 2025 | -- | $25,056 +243.2% |
| 2024 | $286 -11.8% | $7,300 |
| 2023 | $324 +21.7% | $7,300 -8.9% |
| 2022 | $266 | $8,012 +22.9% |
| 2021 | $266 0% | $6,520 -30.6% |
| 2020 | $266 -0.3% | $9,396 +44.1% |
| 2019 | $267 | $6,520 |
| 2018 | $267 | $6,520 |
| 2017 | $267 +356.8% | $6,520 +84% |
| 2016 | $58 | $3,544 -67% |
| 2015 | $58 -67% | $10,739 |
| 2014 | $177 -0.1% | $10,739 |
| 2013 | $178 -59.2% | $10,739 +2.3% |
| 2012 | $435 +162% | $10,493 |
| 2011 | $166 -53.8% | $10,493 |
| 2010 | $359 -17.6% | $10,493 |
| 2009 | $436 | -- |
| 2008 | $436 | -- |
| 2007 | $436 | $10,493 |
| 2006 | $436 | $10,493 |
| 2005 | $436 | $10,493 |
| 2004 | $436 | $10,493 |
| 2003 | -- | $10,493 |
| 2002 | -- | $10,493 |
| 2001 | -- | $10,493 |
| 2000 | -- | $10,493 |
Find assessor info on the county website
Monthly payment
Est. payment$--/mo
Payment breakdown
Explore the cost of this home by adjusting the details. Changes won't be saved.All calculations are estimates and provided by Zillow, Inc. for informational purposes only. Actual amounts may vary.
HOA fees may include property taxes on listings classified as Co-Ops. Contact the listing agent and/or owner for fee details.
Mortgage interest rates are dependent on a number of factors, including credit score, down payment, and repayment length. Interest rate data provided by Zillow Group Marketplace, Inc. as of 1/1/1970 from various mortgage lenders with which we have lead or other similar arrangements; the Estimated Payment is an average of those rates.
See how much you could borrow to make a competitive offer.
Climate risks
Neighborhood: East Carver Heights
Nearby schools
GreatSchools rating
- 2/10Dorothy Height ElementaryGrades: PK-5Distance: 2.9 mi
- 2/10Rothschild Middle SchoolGrades: 6-8Distance: 1.7 mi
- 2/10Carver High SchoolGrades: 9-12Distance: 0.4 mi
A local agent can set up tours, give advice and negotiate with sellers.
A local lender can help you make sure your offer is ready when you are.
Nearby cities
Nearby neighborhoods
Nearby zip codes
Other Columbus Topics
