Move-In Ready Renovated Duplex! This beautifully updated duplex offers 4 bedrooms and 2 bathrooms, with recent improvements completed in 2023-2024. Upgrades include a new roof (2023), new flooring, updated windows, renovated bathrooms, modern kitchens, upgraded PVC drain lines, and a fully fenced yard. The spacious driveway provides parking for up to four vehicles. Separate water meters!! Ideally located near shopping, schools, parks, and major expressways for convenient commuting. Easy to show. Call owner-agent for an appointment.
For sale
Price cut: $20.1K (11/17)
$579,900
10380 SW 173rd St, Miami, FL 33157
4beds
2baths
1,352sqft
Duplex
Built in 1959
-- sqft lot
$-- Zestimate®
$429/sqft
$-- HOA
What's special
Fully fenced yardRenovated bathroomsUpdated windowsModern kitchensNew flooring
- 15 days
- 577
- 60
Likely to sell faster than
Zillow last checked:
Listing updated:
Listed by:
Osmany Mena 305-282-2108,
Miami Brokers Group
Source: MIAMI,MLS#: A12118380 Originating MLS: A-Miami Association of REALTORS
Facts & features
Interior
Bedrooms & bathrooms
- Bedrooms: 4
- Bathrooms: 2
Heating
- Central
Cooling
- Ceiling Fan(s), Central Air
Features
- Flooring: Ceramic Tile
- Windows: Single Hung Metal, Sliding
Interior area
- Total structure area: 1,616
- Total interior livable area: 1,352 sqft
Video & virtual tour
Property
Parking
- Total spaces: 4
Features
- Stories: 1
Lot
- Features: Less Than 1/4 Acre Lot
Details
- Parcel number: 3050320100291
- Zoning: 3050
Construction
Type & style
- Home type: MultiFamily
- Property subtype: Duplex
Materials
- Concrete Block Construction
- Roof: Built-Up
Condition
- Updated/Remodeled
- Year built: 1959
Utilities & green energy
- Sewer: Public Sewer
Community & HOA
Community
- Subdivision: Dixie Heights Garden
HOA
- Has HOA: No
Location
- Region: Miami
Financial & listing details
- Price per square foot: $429/sqft
- Tax assessed value: $300,388
- Annual tax amount: $6,511
- Date on market: 11/4/2026
- Listing terms: All Cash,Conventional,FHA
Estimated market value
Not available
Estimated sales range
Not available
Not available
Price history
| Date | Event | Price |
|---|---|---|
| 11/17/2026 | Price change | $579,900-3.3%$429/sqft |
Source:  MIAMI #A12118380 Report a problem | ||
| 11/4/2026 | Listed for sale | $599,999+86%$444/sqft |
Source: MIAMI #A12118380 Report a problem | ||
| 3/4/2024 | Listing removed | -- |
Source: Zillow Rentals Report a problem | ||
| 2/9/2024 | Listed for rent | $2,300$2/sqft |
Source: Zillow Rentals Report a problem | ||
| 10/10/2023 | Sold | $322,500+35.5%$239/sqft |
Source: Public Record Report a problem | ||
| 11/22/2019 | Listing removed | $238,000$176/sqft |
Source: Keller Williams Realty Premier #A10774200 Report a problem | ||
| 11/16/2019 | Listed for sale | $238,000$176/sqft |
Source: Keller Williams Realty Premier #A10774200 Report a problem | ||
Public tax history
| Year | Property taxes | Tax assessment |
|---|---|---|
| 2025 | $6,511 +0.1% | $300,388 |
| 2024 | $6,506 +52.1% | $300,388 +132.9% |
| 2023 | $4,277 +11.3% | $128,980 +10% |
| 2022 | $3,841 +15.3% | $117,255 +10% |
| 2021 | $3,333 +5.3% | $106,596 +10% |
| 2020 | $3,165 +9.5% | $96,906 +10% |
| 2019 | $2,890 +8.6% | $88,097 +10% |
| 2018 | $2,661 | $80,089 +10% |
| 2017 | $2,661 +7% | $72,809 +10% |
| 2016 | $2,486 +12.6% | $66,190 +10% |
| 2015 | $2,208 +9.2% | $60,173 +10% |
| 2014 | $2,021 +13.9% | $54,703 +10% |
| 2013 | $1,774 | $49,730 +5.1% |
| 2012 | $1,774 -17.1% | $47,296 -28.3% |
| 2011 | $2,139 -27.2% | $65,994 -33.8% |
| 2010 | $2,938 -14.9% | $99,710 -26.3% |
| 2009 | $3,452 -2.9% | $135,340 -5.5% |
| 2007 | $3,556 +23% | $143,161 |
| 2006 | $2,892 | -- |
| 2005 | $2,892 +16.3% | -- |
| 2004 | $2,486 +38.7% | -- |
| 2003 | $1,793 +11.3% | -- |
| 2002 | $1,611 | -- |
| 2001 | $1,611 | -- |
Find assessor info on the county website
Monthly payment
Est. payment
Payment breakdown
Explore the cost of this home by adjusting the details. Changes won't be saved.Climate risks
Neighborhood: West Perrine


Similar homes
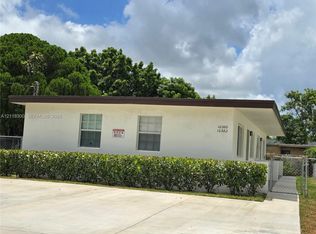
- $549,0004 bd2 ba1.4k sqftDixie Heights Garden, Miami, FL 33157For Sale

 MLS ID #A12091824, Ricardo Arosemena, CasaMagna Realty LLC. MIAMI
- $525,0003 bd2 ba1.3k sqftSouth Miami Heights Addn, Miami, FL 33177For Sale
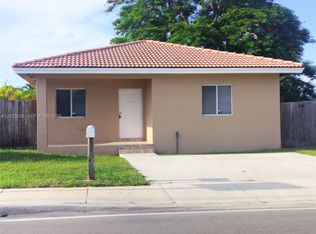 MLS ID #A12125636, Jacques Delbeau Charles, Canvas Real Estate. MIAMI
- $530,0004 bd2 ba1.3k sqftSouth Miami Heights Addn, Miami, FL 33177For Sale
 MLS ID #A12068934, Laura Nieto, Miami New Realty. MIAMI
- $669,9003 bd2 ba1k sqftBel Aire Sec 16, Palmetto Bay, FL 33157For Sale
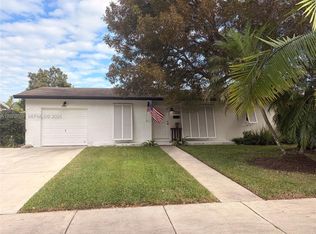 MLS ID #A12070709, Jorge Valdes, The Keyes Company. MIAMI
- $489,0003 bd1 ba1k sqftSouth Miami Heights Addn, Miami, FL 33157For SaleMLS ID #A12093130, Sandra Roman, New Age Realty LLC. MIAMI
- $575,0003 bd1 ba1k sqftReplat Of Portions Of Ric, Miami, FL 33176For SaleMLS ID #A12061521, Julio Veras, Florida Finest Homes Rlty Inc. MIAMI
- $776,0004 bd2 ba1.9k sqftBel Aire Sec 3, Cutler Bay, FL 33157For SaleMLS ID #A12088405, Lazaro Sosa, Southeast Real Estate Advisors Inc.. MIAMI
- $609,0003 bd2 ba1.5k sqftCutler Ridge Sec 4, Cutler Bay, FL 33189For SaleMLS ID #A11792484, Hanadi Ghafir, Coldwell Banker Realty. MIAMI
- $593,0004 bd3 ba1.2k sqft7th Avenue Highlands, Miami, FL 33150For SaleMLS ID #A12114681, Dairon Rubio Castro, Interinvestments Realty, Inc.. MIAMI
- $549,0005 bd2 ba1.5k sqftFloral Park 1st Amd Pl, Miami, FL 33142For SaleMLS ID #A12117728, Adrian Ambros, Florida Realty of Miami Corp. MIAMI
- $599,0005 bd2 ba1.6k sqftGordon Dale Pk, Miami, FL 33150For SaleMLS ID #A12109914, Jorge Andrade PA, Compass Florida, LLC. MIAMI
- $479,9003 bd2 ba1.2k sqftDixie Pines No 2, Miami, FL 33170For SaleMLS ID #A12068312, Kristine Puente, Top Team Realty, LLC.. MIAMI
- $774,9003 bd2 ba1.9k sqftBel Aire Sec 16, Palmetto Bay, FL 33157For SaleMLS ID #A12018367, Jennifer Fernandez, Goldpen Realty Group. MIAMI
- $389,0004 bd3 ba1.6k sqftBluewaters Subdivision, Homestead, FL 33032For SaleMLS ID #A12118321, Aldo Briolo, Cervera Real Estate Inc.. MIAMI
- $545,0004 bd2 ba1.5k sqftAllapattah Sch Sub, Miami, FL 33142For SaleMLS ID #A12062890, Amanda Baralt, Diversified Realty ExchangeLLC. MIAMI
- $595,9006 bd3 ba1.7k sqft17th Ave Manor 2nd Addn, Miami, FL 33142For SaleMLS ID #A12119971, Idalia Nunez, London Foster Realty. MIAMI
- $690,0004 bd2 ba1.7k sqftBird Road Farms, Miami, FL 33165For SaleMLS ID #A12110910, Pedro Lugo, London Foster Realty. MIAMI
- $725,0004 bd2 ba1.7k sqftCountryside, Miami, FL 33177For SaleMLS ID #A12096920, Roberto Valenzuela, One Stop Realty. MIAMI
- $625,0004 bd3 ba1.4k sqftWest End Park Amd Pl, Miami, FL 33142For SaleMLS ID #A12025161, Cuindney Mantilla, Miami Residential Group. MIAMI
- $530,0003 bd3 ba1.7k sqftCourts At Tuscany, Miami, FL 33186For SaleMLS ID #A12065487, Ana Ceballos, LoKation. MIAMI
