$--
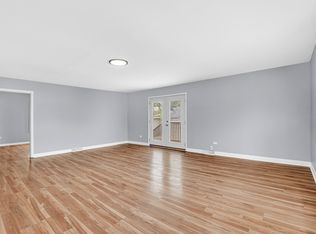
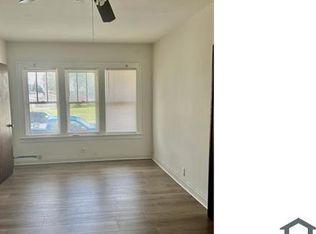
2 bd|1 ba|1.3k sqft
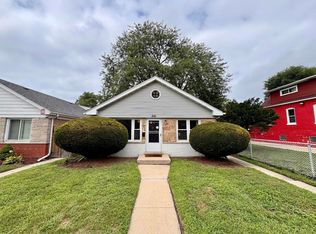
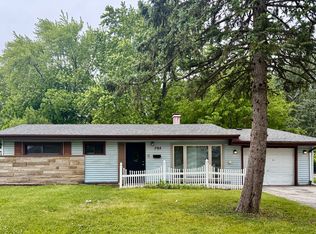
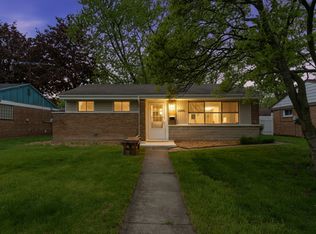
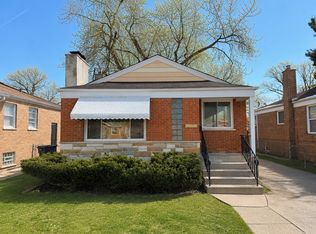
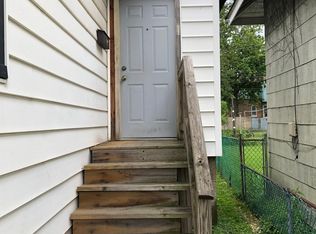
106 Pulaski Rd #1R, Calumet City, IL 60409
Off Market
Zillow last checked:
Listing updated:
Pablo Sarmiento 312-376-6164,
Diaz Case Realty Corp
$166,400
$158,000 - $175,000
$1,665/mo
| Date | Event | Price |
|---|---|---|
| 5/26/2026 | Price change | $169,500-5.6%$241/sqft |
Source: | ||
| 5/13/2026 | Listed for sale | $179,500+385.1%$255/sqft |
Source: | ||
| 8/5/2023 | Listing removed | -- |
Source: Zillow Rentals Report a problem | ||
| 7/26/2023 | Listed for rent | $1,800$3/sqft |
Source: Zillow Rentals Report a problem | ||
| 6/14/2022 | Listing removed | -- |
Source: Zillow Rental Manager Report a problem | ||
| 6/6/2022 | Listed for rent | $1,800$3/sqft |
Source: Zillow Rental Manager Report a problem | ||
| 2/7/2022 | Sold | $37,000-25.9%$53/sqft |
Source: | ||
| 12/20/2021 | Pending sale | $49,900$71/sqft |
Source: | ||
| 12/16/2021 | Contingent | $49,900$71/sqft |
Source: | ||
| 12/1/2021 | Listed for sale | $49,900+25.1%$71/sqft |
Source: | ||
| 2/23/2017 | Listing removed | $39,900$57/sqft |
Source: Coldwell Banker Residential Brokerage - Flossmoor #09287436 Report a problem | ||
| 10/28/2016 | Price change | $39,900-20%$57/sqft |
Source: Coldwell Banker Residential Brokerage - Flossmoor #09287436 Report a problem | ||
| 7/15/2016 | Listed for sale | $49,900-16.8%$71/sqft |
Source: Coldwell Banker Residential Brokerage - Flossmoor #09287436 Report a problem | ||
| 10/11/1996 | Sold | $60,000$85/sqft |
Source: Public Record Report a problem | ||
| Year | Property taxes | Tax assessment |
|---|---|---|
| 2024 | -- | $7,400 +0% |
| 2023 | $4,767 -7.1% | $7,399 +16.2% |
| 2022 | $5,133 +4% | $6,368 |
| 2021 | $4,937 +6.7% | $6,368 |
| 2020 | $4,629 +42.6% | $6,368 +49.9% |
| 2019 | $3,247 +2.1% | $4,249 |
| 2018 | $3,180 +3.5% | $4,249 |
| 2017 | $3,073 +1% | $4,249 -7.4% |
| 2016 | $3,041 +1.8% | $4,591 |
| 2015 | $2,988 -8.2% | $4,591 |
| 2014 | $3,254 +10.9% | $4,591 -9.4% |
| 2013 | $2,935 +2% | $5,068 -4% |
| 2012 | $2,877 +8% | $5,279 |
| 2011 | $2,665 -21.5% | $5,279 -32.8% |
| 2010 | $3,395 +5% | $7,856 |
| 2009 | $3,234 +16% | $7,856 -5% |
| 2008 | $2,788 +10.4% | $8,270 +10.9% |
| 2007 | $2,526 +6.6% | $7,454 |
| 2006 | $2,370 +2% | $7,454 |
| 2005 | $2,323 +22% | $7,454 +22.6% |
| 2004 | $1,904 +3.6% | $6,082 |
| 2003 | $1,838 +7.4% | $6,082 |
| 2002 | $1,711 +24.3% | $6,082 +20% |
| 2001 | $1,376 +2.8% | $5,069 |
| 2000 | $1,338 +15.2% | $5,069 |
| 1999 | $1,162 | $5,069 |
Find assessor info on the county website
Source: MRED as distributed by MLS GRID. This data may not be complete. We recommend contacting the local school district to confirm school assignments for this home.
A local agent can set up tours, give advice and negotiate with sellers.