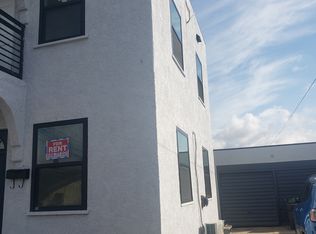
**SHORT SALE – ** Subject to Lender approval and it is a fixer upper investors bring your creativity!
Pending
Listed by: Marsant Realty • Marilu Gonzalez • Contact: 323-321-2387
$550,000
1040 N Almond Ct, Long Beach, CA 90813
2beds
2baths
1sqft
Duplex
Built in 1924
-- sqft lot
$551,800 Zestimate®
$550,000/sqft
$-- HOA
What's special
- 42 days
- 32
- 1
Likely to sell faster than
Zillow last checked:
Listing updated:
Listed by:
Marilu Gonzalez DRE #01758751 323-321-2387,
Marsant Realty
Source: CRMLS,MLS#: DW26134687 Originating MLS: California Regional MLS
Facts & features
Interior
Bedrooms & bathrooms
- Bedrooms: 2
- Bathrooms: 2
Heating
- Natural Gas
Cooling
- None
Appliances
- Laundry: None
Features
- Flooring: Laminate
- Has fireplace: No
- Fireplace features: None
- Common walls with other units/homes: 1 Common Wall
Interior area
- Total structure area: 1
- Total interior livable area: 1 sqft
Property
Accessibility
- Accessibility features: None
Features
- Levels: Two
- Stories: 2
- Entry location: 2
- Pool features: None
- Spa features: None
- Fencing: None
Lot
- Size: 3,149 Square Feet
- Features: 0-1 Unit/Acre
Details
- Parcel number: 7267008039
- Special conditions: Short Sale
Construction
Type & style
- Home type: MultiFamily
- Property subtype: Duplex
- Attached to another structure: Yes
Materials
- Drywall
- Roof: Flat
Condition
- Repairs Cosmetic
- New construction: No
- Year built: 1924
Utilities & green energy
- Electric: Standard
- Sewer: Public Sewer
- Water: Public
- Utilities for property: Natural Gas Available
Community & HOA
Community
- Features: Street Lights
Location
- Region: Long Beach
Financial & listing details
- Price per square foot: $550,000/sqft
- Tax assessed value: $765,000
- Date on market: 6/19/2026
- Cumulative days on market: 43 days
- Listing terms: Conventional,FHA
- Tenant pays: All Utilities, Cable TV, Electricity, Gas
Foreclosure details
Estimated market value
$551,800
$524,000 - $579,000
$1,799/mo
Price history
| Date | Event | Price |
|---|---|---|
| 7/2/2026 | Pending sale | $550,000$550,000/sqft |
Source:  CRMLS #DW26134687 Report a problem | ||
| 6/19/2026 | Listed for sale | $550,000-26.7%$550,000/sqft |
Source: CRMLS #DW26134687 Report a problem | ||
| 12/26/2024 | Sold | $750,000+4.2%$750,000/sqft |
Source: CRMLS #DW24221621 Report a problem | ||
| 10/30/2024 | Pending sale | $720,000$720,000/sqft |
Source: CRMLS #DW24221621 Report a problem | ||
| 10/25/2024 | Listed for sale | $720,000+33.3%$720,000/sqft |
Source: CRMLS #DW24221621 Report a problem | ||
| 4/17/2024 | Sold | $540,000+35.3%$540,000/sqft |
Source: Public Record Report a problem | ||
| 3/24/2021 | Listing removed | -- |
Source: Owner Report a problem | ||
| 12/30/2014 | Listing removed | $399,000$399,000/sqft |
Source: Owner Report a problem | ||
| 12/11/2014 | Listed for sale | $399,000$399,000/sqft |
Source: Owner Report a problem | ||
Public tax history
| Year | Property taxes | Tax assessment |
|---|---|---|
| 2026 | -- | $765,000 +2% |
| 2025 | $9,942 +715.1% | $750,000 +1065.7% |
| 2024 | $1,220 +2% | $64,337 +2% |
| 2023 | $1,196 +5.4% | $63,076 +2% |
| 2022 | $1,134 +3.1% | $61,840 +2% |
| 2021 | $1,100 +0.3% | $60,628 +1% |
| 2020 | $1,097 | $60,008 +2% |
| 2019 | $1,097 +8.7% | $58,832 +2% |
| 2018 | $1,009 | $57,679 +2% |
| 2017 | $1,009 +1.1% | $56,549 +2% |
| 2016 | $998 -64% | $55,441 +1.5% |
| 2015 | $2,775 +207.2% | $54,609 +2% |
| 2014 | $903 | $53,540 +2.5% |
| 2012 | -- | $52,255 +2% |
| 2011 | -- | $51,231 +0.8% |
| 2010 | -- | $50,849 -0.2% |
| 2009 | -- | $50,971 +2% |
| 2008 | -- | $49,972 +2% |
| 2007 | -- | $48,994 +2% |
| 2006 | -- | $48,035 |
| 2005 | -- | $48,035 +4% |
| 2004 | -- | $46,172 +1.9% |
| 2003 | -- | $45,327 +2% |
| 2002 | -- | $44,439 +4% |
| 2000 | -- | $42,715 |
Find assessor info on the county website
Monthly payment
Est. payment
Payment breakdown
Explore the cost of this home by adjusting the details. Changes won't be saved.Climate risks
Neighborhood: Hellman

Local buyer's agents are ready to help
