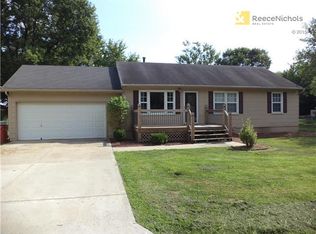
Rare opportunity to own a 3-bedroom, 2-bath ranch home on an oversized 0.55-acre city lot in the heart of Grain Valley! If you've been searching for main-level living with room to spread out, this home offers the perfect combination of space, flexibility, and value.
You'll appreciate the brand-new HVAC system, furnace, and water heater, along with durable fiber-cement siding, fresh white exterior paint, and fresh interior paint, giving you peace of mind while leaving plenty of opportunity to add your own personal style. Inside, the warm neutral palette, shiplap fireplace, and farmhouse-inspired touches create an inviting space that feels like home from the moment you walk in.
Step outside onto the new deck, with a convenient walkway leading to the garage and detached outbuilding—an ideal setup for entertaining, grilling, or simply enjoying your spacious backyard.
One of this property's most unique features is the spacious detached outbuilding with electricity. Whether you need a workshop, home gym, art studio, craft room, home office, hobby space, or extra storage, this versatile building offers endless possibilities. An additional storage shed provides even more room for tools and outdoor equipment.
The large fenced city lot offers space that's hard to find in this price range, with room for pets, gardening, outdoor entertaining, play, or future projects.
Located within walking distance of a local coffee shop, restaurants, a park, Grain Valley High School, and the Mid-Continent Public Library, this home combines small-town charm with everyday convenience. You'll also enjoy quick access to I-70 and other major highways for an easy commute to Independence, Blue Springs, Lee's Summit, and Kansas City.
If you're looking for a move-in-ready ranch home, a large lot, a detached workshop, main-level living, and a location close to schools, parks, and local amenities, this is a home you won't want to miss!
Sold
Zillow last checked:
Listing updated:
Bought with:
Felicia Davis, 2005034998
EXP Realty LLC
Source: Heartland MLS as distributed by MLS GRID,MLS#: 2630395
Price history
| Date | Event | Price |
|---|---|---|
| 10/16/2026 | Sold | -- |
Source:  Heartland MLS as distributed by MLS GRID #2630395 Report a problem Heartland MLS as distributed by MLS GRID #2630395 Report a problem | ||
| 8/20/2026 | Contingent | $298,000$189/sqft |
Source: Heartland MLS as distributed by MLS GRID #2630395 Report a problem | ||
| 8/12/2026 | Listed for sale | $298,000+70.3%$189/sqft |
Source: Heartland MLS as distributed by MLS GRID #2630395 Report a problem | ||
| 7/10/2019 | Sold | -- |
Source: Heartland MLS as distributed by MLS GRID #45001_2165627 Report a problem | ||
| 6/9/2019 | Pending sale | $175,000$111/sqft |
Source: ReeceNichols Blue Springs #2165627 Report a problem | ||
| 6/5/2019 | Listed for sale | $175,000$111/sqft |
Source: ReeceNichols Blue Springs #2165627 Report a problem | ||
| 5/23/2019 | Pending sale | $175,000$111/sqft |
Source: ReeceNichols Blue Springs #2165627 Report a problem | ||
| 5/17/2019 | Listed for sale | $175,000+133.3%$111/sqft |
Source: ReeceNichols Blue Springs #2165627 Report a problem | ||
| 4/13/2015 | Listing removed | $75,000$47/sqft |
Source: Realty Executives Broker of Record #HMLSKS Report a problem | ||
| 4/8/2015 | Pending sale | $75,000$47/sqft |
Source: Realty Executives Broker of Record #HMLSKS Report a problem | ||
| 4/8/2015 | Listed for sale | $75,000$47/sqft |
Source: Realty Executives Broker of Record #HMLSKS Report a problem | ||
| 3/21/2015 | Sold | -- |
Source: Heartland MLS as distributed by MLS GRID #1916233 Report a problem | ||
| 2/14/2015 | Pending sale | $75,000$47/sqft |
Source: REALTY EXECUTIVES of Kansas City #1916233 Report a problem | ||
| 12/28/2014 | Listed for sale | $75,000$47/sqft |
Source: REALTY EXECUTIVES of Kansas City #1916233 Report a problem | ||

Get a cash offer in 3 minutes
Find out how much your home could sell for in as little as 3 minutes with a no-obligation cash offer.
Estimated market value
$292,900
