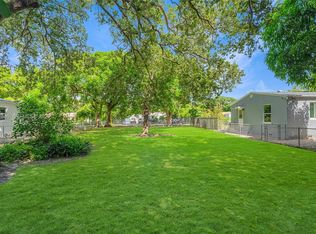
5,100 sq. ft. lot situated just minutes from Wynwood, Midtown, the Design District. The current structure is subject to an Order of the Unsafe Structures Panel issued by the City of Miami. Offered strictly AS-IS for cash or hard-money buyers only. Buyer must conduct independent due diligence with the City of Miami regarding the current status of the order, required repairs, permits, violations, potential fines, and any demolition-related requirements. Buyer is responsible for all due diligence, including determining the feasibility and cost of rehabilitation, permitting, repairs, or redevelopment. Do not enter the property without prior authorization. All information regarding the unsafe structures matter should be independently verified with the City of Miami.
Lot/land
Price cut: $64K (11/4)
$335,000
1053 NW 55th St, Miami, FL 33127
--beds
--baths
4,791Square Feet
Unimproved Land
Built in ----
4,791 Square Feet Lot
$312,300 Zestimate®
$--/sqft
$-- HOA
What's special
- 30 days
- 245
- 13
Likely to sell faster than
Zillow last checked:
Listing updated:
Listed by:
Jason Smith 786-326-8115,
Keller Williams Capital Realty,
Carolina Grunbaum Botbol 786-238-4950,
Keller Williams Capital Realty
Source: MIAMI,MLS#: A12111416 Originating MLS: A-Miami Association of REALTORS
Facts & features
Interior
Video & virtual tour
Property
Features
- Fencing: Fenced
Lot
- Size: 4,791 Square Feet
- Features: Less Than 1/4 Acre Lot
- Residential vegetation: Other Trees
Details
- Additional structures: Other Bldg Incl
- Parcel number: 0131140320200
- Zoning: 5700
Utilities & green energy
- Sewer: Public Sewer
- Water: Municipal Water
Community & HOA
Community
- Subdivision: Bowling Green Extension
HOA
- Has HOA: No
Location
- Region: Miami
Financial & listing details
- Tax assessed value: $279,558
- Annual tax amount: $5,200
- Date on market: 10/22/2026
- Listing terms: Cash
Estimated market value
$312,300
$275,000 - $350,000
Not available
Price history
| Date | Event | Price |
|---|---|---|
| 11/4/2026 | Price change | $335,000-16% |
Source:  MIAMI #A12103330 Report a problem | ||
| 10/13/2026 | Listed for sale | $399,000+121.7% |
Source: MIAMI #A12103330 Report a problem | ||
| 3/11/2021 | Sold | $180,000+21.6% |
Source: Public Record Report a problem | ||
| 2/13/2020 | Listing removed | $148,000 |
Source: Citywide Realty Inc #A10814465 Report a problem | ||
| 2/8/2020 | Listed for sale | $148,000+469.2% |
Source: Citywide Realty Inc #A10814465 Report a problem | ||
| 9/1/2013 | Listing removed | $1,150 |
Source: choice realty of miami inc Report a problem | ||
| 7/11/2013 | Listed for rent | $1,150 |
Source: Go Section8 Report a problem | ||
| 1/10/2013 | Sold | $26,000 |
Source: Public Record Report a problem | ||
Public tax history
| Year | Property taxes | Tax assessment |
|---|---|---|
| 2025 | $5,417 +12.8% | $238,298 +10% |
| 2024 | $4,801 +6.9% | $216,635 +10% |
| 2023 | $4,489 +10.3% | $196,941 +10% |
| 2022 | $4,071 +46.9% | $179,038 +74.7% |
| 2021 | $2,771 +9.1% | $102,509 +10% |
| 2020 | $2,540 +11.6% | $93,190 +10% |
| 2019 | $2,276 +14.2% | $84,719 +10% |
| 2018 | $1,993 | $77,018 +133.9% |
| 2017 | $1,993 +65% | $32,932 +10% |
| 2016 | $1,208 +14.8% | $29,939 +10% |
| 2015 | $1,052 +6.1% | $27,218 +10% |
| 2014 | $992 +160.9% | $24,744 +10% |
| 2013 | $380 | $22,495 +16.6% |
| 2012 | $380 | $19,289 +3% |
| 2011 | $380 | $18,728 +1.5% |
| 2010 | $380 +4.1% | $18,452 +2.7% |
| 2009 | $365 +12.3% | $17,967 +3.1% |
| 2007 | $325 -12.4% | $17,428 |
| 2006 | $371 | -- |
| 2005 | $371 -3.9% | -- |
| 2004 | $386 | -- |
| 2003 | $386 | -- |
| 2002 | $386 | -- |
| 2001 | $386 | -- |
Find assessor info on the county website
Monthly payment
Climate risks
Neighborhood: Liberty City
Similar homes
- $355,0006,098 sqftBowling Green Extension, Miami, FL 33127Lot/Land

 MLS ID #A12081507, Marielba Hicher Rachadey, Keller Williams Realty International Lifestyles. MIAMI
- $240,0005,296 sqftOrchard Villa Extension, Miami, FL 33142Lot/Land
 MLS ID #A12124880, Alina Del Portal, Capital Homes Inc. MIAMI
- $299,0006,777 sqftDurham Village, Miami, FL 33127Lot/Land
 MLS ID #A12091046, Maria Achury, Dalton Wade Inc. MIAMI
- $349,0005,488 sqftFloral Pk 1st Amd, Miami, FL 33142Lot/Land
 MLS ID #A12062656, David Deleon, Compass Florida, LLC. MIAMI
- $185,0005,000 sqftN Miami Estates, Miami, FL 33142Lot/LandMLS ID #A12126583, Angel Barreiro, BRS. MIAMI
- $422,0008,276 sqftBowling Green, Miami, FL 33127Lot/LandMLS ID #A12088537, Noelia Quinonez PA, LoKation. MIAMI
- $499,0005,662 sqftMiami Ave Sub, Miami, FL 33127Lot/LandMLS ID #A12032850, Sol Fonseca, Florida Realty of Miami Corp. MIAMI
- $499,0004,791 sqftDe Leon Park, Miami, FL 33127Lot/LandMLS ID #A12014368, Octavio Cordoves, Real Estate Sales Force. MIAMI
- $345,0005,401 sqftGlenhaven, Miami, FL 33142Lot/LandMLS ID #A12082693, Patrice Hallot, London Foster Realty. MIAMI
- $320,0005,828 sqftOrange Heights, Miami, FL 33142Lot/LandMLS ID #A12031048, Anna Carolina Noto, Related General Realty, LLC.. MIAMI
- $300,0006,098 sqftCentral Allapattah, Miami, FL 33142Lot/LandMLS ID #A12106018, Gregory Celentano, Union Street Partners, LLC. MIAMI
- $340,0005,000 sqftPlainfield Park, Miami, FL 33125Lot/LandMLS ID #A12083155, Ernesto Varela Echevarria, Phantom Real Estate. MIAMI
- $349,5005,397 sqftWesthaven, Miami, FL 33142Lot/LandMLS ID #A12009110, William Rios, Florida Capital Realty. MIAMI
- $399,0005,279 sqftE Court Of Phoenix Pk A R, Miami, FL 33150Lot/LandMLS ID #A12062673, David Deleon, Compass Florida, LLC. MIAMI
- $220,0005,314 sqftOrange Heights, Miami, FL 33142Lot/LandMLS ID #A12041444, Kanisha Williams, Elite Realty Partners, Inc.. MIAMI
- $349,0005,401 sqftEast Haven, Miami, FL 33142Lot/LandMLS ID #A12021548, Jeanete Dahan, J. Dahan Rlty, Inc.. MIAMI
- $250,0004,386 sqft13 53 41 N43ft Of S308ft, Miami, FL 33150Lot/LandMLS ID #A12038934, Aleksandar Ilic, LX Realty LLC. MIAMI
- $282,0003,201 sqftWaite Sub, Miami, FL 33125Lot/LandMLS ID #A12064928, Alexa Martinez, Compass Florida, LLC. MIAMI
- $250,0002,626 sqftDixie Hwy Park, Miami, FL 33138Lot/LandMLS ID #A11971287, Leslie Dorn, The Keyes Company. MIAMI
- $299,00012 acresHollywood South Side Add, Hollywood, FL 33020Lot/LandMLS ID #A12126755, Ekaterina Molina, Molina Realty. MIAMI
