Beautiful 1-bedroom, 1 Bath apartment on the First Floor in the great Metro West area, right in front of the pool. Fully renovated. New Washer and Dryer. Amenities included: gym, clubhouse, and pool.
For sale
$135,000
1055 S Hiawassee Rd APT 2014, Orlando, FL 32835
1beds
627sqft
Condominium
Built in 1989
-- sqft lot
$-- Zestimate®
$215/sqft
$423/mo HOA
What's special
Fully renovatedNew washer and dryer
- 25 days
- 207
- 18
Zillow last checked:
Listing updated:
Listed by:
Maria Bedoya 954-449-5820,
One Stop Realty
Source: MIAMI,MLS#: A12107913 Originating MLS: A-Miami Association of REALTORS
Facts & features
Interior
Bedrooms & bathrooms
- Bedrooms: 1
- Bathrooms: 1
- Full bathrooms: 1
Heating
- Central
Cooling
- Central Air, Electric
Appliances
- Included: Dishwasher, Dryer, Electric Range, Electric Water Heater, Microwave, Refrigerator, Washer
Features
- Walk-In Closet(s)
- Windows: Blinds
Interior area
- Total interior livable area: 627 sqft
Video & virtual tour
Property
Parking
- Parking features: 2 Or More Spaces, Assigned, Guest, No Rv/Boats, No Trucks/Trailers
Features
- Levels: One
- Entry location: First Floor Entry
- Patio & porch: Patio
- Fencing: Fenced
- Has view: Yes
- View description: Garden, Pool
Details
- Parcel number: 362228866820140
Construction
Type & style
- Home type: Condo
- Property subtype: Condominium
- Attached to another structure: Yes
Materials
- CBS Construction
Condition
- Year built: 1989
Details
- Builder model: 1/1, First Floor
Utilities & green energy
- Electric: Circuit Breakers
Community & HOA
Community
- Security: Complex Fenced
- Application fee: $100
- Subdivision: Tradewinds
HOA
- Has HOA: Yes
- Amenities included: Playground, Fitness Center, Exterior Lighting, Other
- HOA fee: $423 monthly
Location
- Region: Orlando
Financial & listing details
- Price per square foot: $215/sqft
- Tax assessed value: $116,000
- Annual tax amount: $2,256
- Date on market: 10/16/2026
- Listing terms: All Cash,Conventional,FHA
- Ownership: Self Proprietor/Individual
Estimated market value
Not available
Estimated sales range
Not available
Not available
Price history
| Date | Event | Price |
|---|---|---|
| 10/16/2026 | Listed for sale | $135,000-6.9%$215/sqft |
Source:  MIAMI #A12107913 Report a problem | ||
| 10/14/2026 | Price change | $1,380-1.4%$2/sqft |
Source: MIAMI #A12097426 Report a problem | ||
| 9/29/2026 | Listed for rent | $1,400+1.4%$2/sqft |
Source: MIAMI #A12097426 Report a problem | ||
| 5/7/2026 | Listing removed | $1,380$2/sqft |
Source: MIAMI #A11941883 Report a problem | ||
| 1/26/2026 | Price change | $1,380-8%$2/sqft |
Source: MIAMI #A11941883 Report a problem | ||
| 1/16/2026 | Price change | $1,500-6.3%$2/sqft |
Source: MIAMI #A11941883 Report a problem | ||
| 1/9/2026 | Listed for rent | $1,600+6.7%$3/sqft |
Source: MIAMI #A11941883 Report a problem | ||
| 8/18/2025 | Listing removed | $145,000$231/sqft |
Source: MIAMI #A11805207 Report a problem | ||
| 5/20/2025 | Listed for sale | $145,000-11%$231/sqft |
Source: MIAMI #A11805207 Report a problem | ||
| 3/19/2024 | Listing removed | -- |
Source: MIAMI #A11546622 Report a problem | ||
| 3/8/2024 | Listed for rent | $1,500$2/sqft |
Source: MIAMI #A11546622 Report a problem | ||
| 2/27/2024 | Sold | $163,000-1.2%$260/sqft |
Source:  Stellar MLS #O6150728 Report a problem | ||
| 1/29/2024 | Pending sale | $165,000$263/sqft |
Source: Stellar MLS #O6150728 Report a problem | ||
| 1/25/2024 | Price change | $165,000-1.2%$263/sqft |
Source: Stellar MLS #O6150728 Report a problem | ||
| 1/11/2024 | Price change | $167,000-2.9%$266/sqft |
Source: Stellar MLS #O6150728 Report a problem | ||
| 11/2/2023 | Price change | $172,000-1.7%$274/sqft |
Source: Stellar MLS #O6150728 Report a problem | ||
| 10/18/2023 | Listed for sale | $175,000+2.3%$279/sqft |
Source: Stellar MLS #O6150728 Report a problem | ||
| 5/23/2022 | Sold | $171,000+3.6%$273/sqft |
Source: Public Record Report a problem | ||
| 5/3/2022 | Pending sale | $165,000$263/sqft |
Source: Stellar MLS #S5066617 Report a problem | ||
| 4/29/2022 | Listed for sale | $165,000+61.8%$263/sqft |
Source: Stellar MLS #S5066617 Report a problem | ||
| 3/30/2022 | Sold | $102,000-25.8%$163/sqft |
Source: Public Record Report a problem | ||
| 5/10/2006 | Sold | $137,400$219/sqft |
Source: Public Record Report a problem | ||
Public tax history
| Year | Property taxes | Tax assessment |
|---|---|---|
| 2024 | $2,135 +76.6% | $116,000 +8.8% |
| 2023 | $1,209 -25.6% | $106,600 +22.8% |
| 2022 | $1,626 +8.6% | $86,807 +10% |
| 2021 | $1,497 +5.1% | $78,915 +10% |
| 2020 | $1,424 +11.7% | $71,741 +10% |
| 2019 | $1,275 +10.3% | $65,219 +10% |
| 2018 | $1,156 | $59,290 +10% |
| 2017 | $1,156 +8.9% | $53,900 -4.3% |
| 2016 | $1,061 -1.1% | $56,300 +19.8% |
| 2015 | $1,073 +17.8% | $47,000 +7.6% |
| 2014 | $911 +9.7% | $43,700 +4% |
| 2013 | $831 -3.2% | $42,017 -2.7% |
| 2012 | $858 -1.7% | $43,192 -1.5% |
| 2011 | $874 -2.2% | $43,831 -5.1% |
| 2010 | $893 | $46,200 +7.5% |
| 2009 | -- | $42,975 -55% |
| 2008 | $1,768 -11.6% | $95,500 -15.5% |
| 2007 | $2,000 +32.1% | $113,000 +45.1% |
| 2006 | $1,513 | $77,884 |
Find assessor info on the county website
Monthly payment
Est. payment
Payment breakdown
Explore the cost of this home by adjusting the details. Changes won't be saved.Climate risks
Neighborhood: Metro West
- $151,0001 bd1 ba627 sqft1055 S Hiawassee Rd APT 2023, Orlando, FL 32835Sold

- $121,2001 bd1 ba627 sqft1055 S Hiawassee Rd APT 2036, Orlando, FL 32835Off Market

- $171,6002 bd2 ba934 sqft1055 S Hiawassee Rd APT 2011, Orlando, FL 32835Off Market

- $148,8002 bd2 ba934 sqft1055 S Hiawassee Rd APT 2012, Orlando, FL 32835Off Market

Similar homes
- $129,9001 bd1 ba673 sqft1079 S HIAWASSEE ROAD #1113, ORLANDO, FL 32835For Sale

 MLS ID #S5159134, Nancy Gittens De Jimenez, BARTO REAL ESTATE LLC. Stellar MLS
- $140,0002 bd2 ba829 sqft1073 S HIAWASSEE ROAD #1011, ORLANDO, FL 32835For SaleMLS ID #S5159118, Nancy Gittens De Jimenez, BARTO REAL ESTATE LLC. Stellar MLS
- $119,0001 bd1 ba673 sqft1083 S HIAWASSEE ROAD #623, ORLANDO, FL 32835For Sale
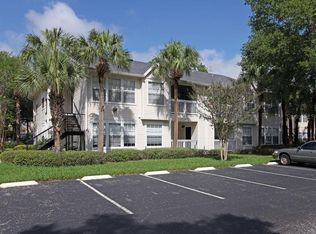 MLS ID #O6451578, Ryan Langley, FLORIDA REALTY INVESTMENTS. Stellar MLS
- $120,0001 bd1 ba673 sqft1037 S HIAWASSEE ROAD #2835, ORLANDO, FL 32835For Sale
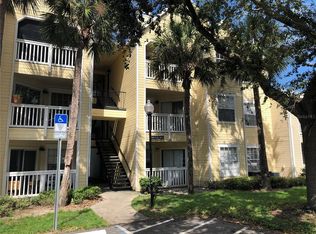 MLS ID #O6408975, Andre Leirias, LLC, GOLDEN DOOR REALTY. Stellar MLS
- $155,0002 bd2 ba829 sqft1027 S HIAWASSEE ROAD #2311, ORLANDO, FL 32835For SaleMLS ID #O6408916, Inga Bateman, FATHOM REALTY FL LLC. Stellar MLS
- $136,9001 bd1 ba840 sqft5512 METROWEST BOULEVARD #12-109, ORLANDO, FL 32811For SaleMLS ID #O6451037, Irina Kempe, NEW SOLUTIONS REALTY INC. Stellar MLS
- $135,0001 bd1 ba711 sqft5140 CONROY ROAD #35, ORLANDO, FL 32811For SaleMLS ID #O6429100, Solon Potenciano Silva, LEGACY PLUS REALTY. Stellar MLS
- $170,0001 bd1 ba674 sqft2674 ROBERT TRENT JONES DRIVE #334, ORLANDO, FL 32835For SaleMLS ID #O6438558, Leonardo Sanchez, MAXI ESTATE REALTY INC. Stellar MLS
- $145,0001 bd1 ba711 sqft5160 CONROY ROAD #14, ORLANDO, FL 32811For SaleMLS ID #S5148623, Ane Bertol Bertol, AXEN REALTY LLC. Stellar MLS
- $135,0001 bd1 ba597 sqft5128 CONROY ROAD #25, ORLANDO, FL 32811For SaleMLS ID #O6410885, Dirimo Chourio, VESTA REALTY LLC. Stellar MLS
- $135,0001 bd1 ba597 sqft5108 CONROY ROAD #1713, ORLANDO, FL 32811For SaleMLS ID #S5135906, Maria Gomez Arevalo, PA, MY REALTY GROUP, LLC.. Stellar MLS
- $124,9001 bd1 ba742 sqft6120 CURRY FORD ROAD #140, ORLANDO, FL 32822For SaleMLS ID #O6453728, Gloria Alvarez, CENTURY 21 CARIOTI. Stellar MLS
- $139,9002 bd2 ba874 sqft5124 PARK CENTRAL DRIVE #513, ORLANDO, FL 32839For SaleMLS ID #O6443659, Nilda Juncos, ICON REALTY ASSOCIATES INC. Stellar MLS
- $129,5001 bd1 ba591 sqft5926 PEREGRINE AVENUE #A13, ORLANDO, FL 32819For SaleMLS ID #O6430722, Christine DiRienzo, REAL ESTATE FIRM OF ORLANDO. Stellar MLS
- $124,9002 bd2 ba767 sqft5999 VILLAGE CIRCLE #990, ORLANDO, FL 32822For SaleMLS ID #O6451654, Carmen Serrano Giubilei, RE/MAX EXCLUSIVE COLLECTION. Stellar MLS
- $185,0002 bd1 ba933 sqft2528 ROBERT TRENT JONES DRIVE #1625, ORLANDO, FL 32835For SaleMLS ID #O6386331, Marino Sanchez, MAXI ESTATE REALTY INC. Stellar MLS
- $158,0001 bd1 ba711 sqft5124 CONROY ROAD #33, ORLANDO, FL 32811For SaleMLS ID #O6451018, Dirimo Chourio, VESTA REALTY LLC. Stellar MLS
- $140,0002 bd2 ba864 sqft1972 LAKE ATRIUMS CIRCLE #200, ORLANDO, FL 32839For SaleMLS ID #O6423312, Dirimo Chourio, VESTA REALTY LLC. Stellar MLS
- $129,9001 bd1 ba660 sqft1916 LAKE ATRIUMS CIRCLE #33, ORLANDO, FL 32839For SaleMLS ID #O6434616, Jack Rojas, DOMUS REAL ESTATE LLC. Stellar MLS
- $130,0002 bd2 ba864 sqft1972 LAKE ATRIUMS CIRCLE #199, ORLANDO, FL 32839For SaleMLS ID #O6435303, Jack Rojas, DOMUS REAL ESTATE LLC. Stellar MLS
