Pre-foreclosure
Est. $1,042,900
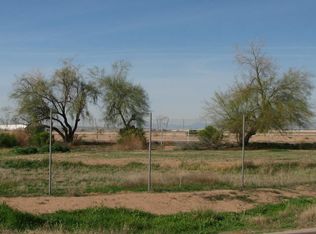
10571 W Rancho Dr, Glendale, AZ 85307
--beds
0baths
0.62Acres
VacantLand
Built in 1980
0.62 Acres Lot
$1,042,900 Zestimate®
$211/sqft
$-- HOA
Overview
- 57 days |
- 48 |
- 2 |
Facts & features
Interior
Bedrooms & bathrooms
- Bathrooms: 0
Heating
- Other
Cooling
- Refrigerator
Interior area
- Total interior livable area: 4,952 sqft
Property
Parking
- Total spaces: 6
- Parking features: Carport
Features
- Exterior features: Cement / Concrete
Lot
- Size: 0.62 Acres
Details
- Parcel number: 10216550
Community & HOA
Location
- Region: Glendale
Financial & listing details
- Price per square foot: $211/sqft
- Tax assessed value: $1,296,700
- Annual tax amount: $13,697
Visit our professional directory to find a foreclosure specialist in your area that can help with your home search.
Find a foreclosure agentForeclosure details
Estimated market value
$1,042,900
$657,000 - $1.53M
$2,223/mo
Price history
| Date | Event | Price |
|---|---|---|
| 2/24/2016 | Listing removed | $110,000$22/sqft |
Source: Traw Realty #5308558 Report a problem | ||
| 2/1/2016 | Price change | $110,000-35.3%$22/sqft |
Source: Traw Realty #5308558 Report a problem | ||
| 11/8/2015 | Price change | $170,000-15%$34/sqft |
Source: Traw Realty #5308558 Report a problem | ||
| 7/17/2015 | Listed for sale | $200,000+63.3%$40/sqft |
Source: Traw Realty #5308558 Report a problem | ||
| 7/3/1995 | Sold | $122,500$25/sqft |
Source: Public Record Report a problem | ||
Public tax history
| Year | Property taxes | Tax assessment |
|---|---|---|
| 2025 | $13,697 +12.1% | $129,670 -4.4% |
| 2024 | $12,215 -1.6% | $135,660 +67.3% |
| 2023 | $12,419 +2.9% | $81,091 -6.6% |
| 2022 | $12,074 +7.8% | $86,810 +0.1% |
| 2021 | $11,199 +0.9% | $86,680 -0.3% |
| 2020 | $11,100 +6.3% | $86,980 +6.8% |
| 2019 | $10,439 | $81,460 +0.7% |
| 2018 | $10,439 +7.1% | $80,930 +3.2% |
| 2017 | $9,746 +13% | $78,410 +8.4% |
| 2016 | $8,623 -3.4% | $72,340 -4.5% |
| 2015 | $8,923 | $75,750 +32.4% |
| 2014 | -- | $57,230 +20.4% |
| 2013 | -- | $47,520 -5.4% |
| 2012 | -- | $50,210 -27.6% |
| 2011 | -- | $69,330 -5.2% |
| 2010 | -- | $73,150 -4.6% |
| 2009 | -- | $76,700 -13.1% |
| 2008 | -- | $88,250 +11.6% |
| 2007 | -- | $79,100 +115.8% |
| 2006 | -- | $36,650 |
| 2005 | -- | $36,650 +32.5% |
| 2004 | -- | $27,650 +54.5% |
| 2003 | -- | $17,900 +47.9% |
| 2002 | -- | $12,100 |
Find assessor info on the county website
Monthly payment
Estimated monthly payment$1,822
All calculations are estimates and provided by Zillow, Inc. for informational purposes only. Actual amounts may vary.
HOA fees may include property taxes on listings classified as Co-Ops. Contact the listing agent and/or owner for fee details.
Mortgage interest rates are dependent on a number of factors, including credit score, down payment, and repayment length. Interest rate data provided by Zillow Group Marketplace, Inc. as of 1/1/1970 from various mortgage lenders with which we have lead or other similar arrangements; the Estimated Payment is an average of those rates.
See how much you could borrow to make a competitive offer.
Climate risks
Neighborhood: Maryvale
Nearby schools
GreatSchools rating
- 2/10Sonoran Sky Elementary SchoolGrades: PK-8Distance: 0.5 mi
- 4/10Westview High SchoolGrades: 9-12Distance: 2.2 mi


- Arizona
- Maricopa County
- Phoenix
- 85307
- Maryvale
- 10571 W Rancho Dr
Nearby cities
Nearby neighborhoods
Nearby zip codes
Other Phoenix Topics
