Well-located 4-bedroom, 2-bath in Jacksonville, offering 1,188 square feet of living space on a 4,900 square foot lot. Built in 1956.
Active
$66,000
1058 W 19TH Street, Jacksonville, FL 32209
4beds
1,188sqft
Single Family Residence
Built in 1956
4,791 Square Feet Lot
$78,300 Zestimate®
$56/sqft
$-- HOA
What's special
- 12 hours
- 181
- 15
Zillow last checked:
Listing updated:
Listed by:
RYAN CALL 904-807-1978,
REALTY ZOOM 904-807-1978
Source: realMLS,MLS#: 2170221
Facts & features
Interior
Bedrooms & bathrooms
- Bedrooms: 4
- Bathrooms: 2
- Full bathrooms: 2
Heating
- Central, Heat Pump
Cooling
- Central Air
Appliances
- Included: Refrigerator
Features
- Flooring: Carpet, Tile, Vinyl
Interior area
- Total structure area: 1,188
- Total interior livable area: 1,188 sqft
Property
Parking
- Parking features: Off Street
Features
- Stories: 1
Lot
- Size: 4,791 Square Feet
Details
- Parcel number: 0467370000
Construction
Type & style
- Home type: SingleFamily
- Property subtype: Single Family Residence
Materials
- Wood Siding
- Roof: Metal
Condition
- New construction: No
- Year built: 1956
Utilities & green energy
- Sewer: Public Sewer
- Water: Public
- Utilities for property: Cable Available, Electricity Available, Sewer Available, Water Available
Community & HOA
Community
- Subdivision: Trout River
HOA
- Has HOA: No
Location
- Region: Jacksonville
Financial & listing details
- Price per square foot: $56/sqft
- Tax assessed value: $71,091
- Annual tax amount: $706
- Date on market: 10/21/2026
- Listing terms: Cash,Conventional
Estimated market value
$78,300
$56,000 - $106,000
$1,212/mo
Price history
| Date | Event | Price |
|---|---|---|
| 10/21/2026 | Listed for sale | $66,000$56/sqft |
Source:  realMLS #2170221 Report a problem | ||
Public tax history
| Year | Property taxes | Tax assessment |
|---|---|---|
| 2025 | $707 +95% | $23,044 +2.9% |
| 2024 | $362 | $22,395 +3% |
| 2023 | $362 | $21,743 +3% |
| 2022 | $362 | $21,110 +3% |
| 2021 | $362 | $20,496 +1.4% |
| 2020 | $362 | $20,214 +2.3% |
| 2019 | $362 | $19,760 +1.9% |
| 2018 | $362 | $19,392 +5.8% |
| 2017 | $362 -47.9% | $18,330 +10.8% |
| 2016 | $695 +3.8% | $16,545 -29.8% |
| 2015 | $670 -17.1% | $23,575 -0.8% |
| 2014 | $808 | $23,774 -7.9% |
| 2013 | -- | $25,825 +18.2% |
| 2012 | -- | $21,852 +0.9% |
| 2011 | -- | $21,665 -16.5% |
| 2010 | -- | $25,948 -1.1% |
| 2009 | -- | $26,233 -24.4% |
| 2006 | -- | $34,691 +7.5% |
| 2005 | $599 | $32,273 +8.8% |
| 2004 | -- | $29,673 +3.5% |
| 2003 | $556 | $28,673 +3.2% |
| 2002 | -- | $27,773 +342.7% |
| 2001 | -- | $6,273 |
| 2000 | -- | $6,273 |
| 1999 | -- | $6,273 |
Find assessor info on the county website
Monthly payment
Est. payment
Payment breakdown
Explore the cost of this home by adjusting the details. Changes won't be saved.Climate risks
Neighborhood: Mid-Westside


Similar homes
- $69,0004 bd2 ba1.2k sqft315 WOODLAWN Avenue, Jacksonville, FL 32204For Sale
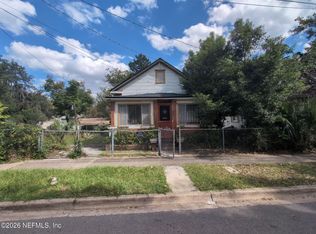 MLS ID #2170113, MAURI MATIAS OSKARI MATTSSON. realMLS
- $69,0003 bd1 ba1.1k sqft918 W 27TH Street, Jacksonville, FL 32209For Sale
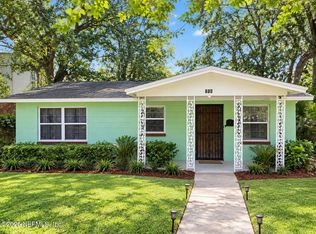 MLS ID #2162494, MAURI MATIAS OSKARI MATTSSON. realMLS
- $50,0002 bd1 ba1k sqft1743 W 30TH Street, Jacksonville, FL 32209For Sale
 MLS ID #2169912, SHARMINEE LOPEZ. realMLS
- $61,0002 bd1 ba648 sqft1087 W 29TH Street, Jacksonville, FL 32209For Sale
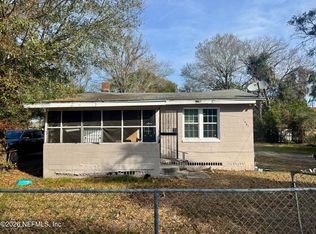 MLS ID #2131083, KRAVIN C ELLISON. realMLS
