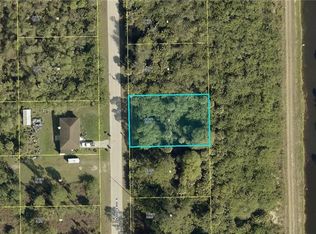
Discover a fantastic opportunity with this cleared residential lot located in a rapidly growing area of Lehigh Acres. Convenient location near shopping, schools, restaurants, and major roadways, this property offers the perfect combination of accessibility and potential. Whether you're looking to build your dream home, create a future investment, or secure land in a growing market. Don't miss your chance to own a piece of Sunny Florida and bring your vision to life!
Active
$32,000
1076 Bells St E, Lehigh Acres, FL 33974
--beds
--baths
10,001Square Feet
Unimproved Land
Built in ----
10,001 Square Feet Lot
$-- Zestimate®
$--/sqft
$-- HOA
What's special
Cleared residential lot
- 18 days
- 21
- 0
Zillow last checked:
Listing updated:
Listed by:
Nohemy Garcia 239-849-6782,
MGR Realty Services, Inc.
Source: Florida Gulf Coast MLS,MLS#: 2026044485 Originating MLS: Florida Gulf Coast
Facts & features
Interior
Video & virtual tour
Property
Features
- Has view: Yes
- View description: Partial Buildings
- Waterfront features: None
Lot
- Size: 10,001 Square Feet
- Dimensions: 80 x 125 x 80 x 125
- Features: Rectangular Lot
Details
- Parcel number: 114527L312048.0090
- Lease amount: $0
- Zoning description: RS-1
Utilities & green energy
- Sewer: None
- Water: None
- Utilities for property: None, Sewer Not Available, Water Not Available
Community & HOA
Community
- Features: None
- Condo and coop fee: $0
- Membership fee: $0
- Subdivision: LEHIGH ACRES
HOA
- Services included: None
Location
- Region: Lehigh Acres
Financial & listing details
- Tax assessed value: $15,343
- Annual tax amount: $421
- Date on market: 10/22/2026
- Cumulative days on market: 23 days
- Listing terms: Cash
Estimated market value
Not available
Estimated sales range
Not available
Not available
Price history
| Date | Event | Price |
|---|---|---|
| 10/26/2026 | Listed for sale | $32,000+28% |
Source:  Florida Gulf Coast MLS #2026044485 Report a problem | ||
| 7/1/2026 | Listing removed | $25,000 |
Source: Florida Gulf Coast MLS #2026008788 Report a problem | ||
| 2/18/2026 | Listed for sale | $25,000+6.4% |
Source: Florida Gulf Coast MLS #2026008788 Report a problem | ||
| 10/1/2025 | Listing removed | $23,500 |
Source: Florida Gulf Coast MLS #225024064 Report a problem | ||
| 9/11/2025 | Price change | $23,500-7.8% |
Source: Florida Gulf Coast MLS #225024064 Report a problem | ||
| 6/5/2025 | Price change | $25,500-7.3% |
Source:  SWFLMLS #225024064 Report a problem | ||
| 5/28/2025 | Listed for sale | $27,500-6.5% |
Source: SWFLMLS #225024064 Report a problem | ||
| 3/1/2025 | Listing removed | $29,400 |
Source: SWFLMLS #224094882 Report a problem | ||
| 2/4/2025 | Listed for sale | $29,400+145% |
Source: SWFLMLS #224094882 Report a problem | ||
| 1/13/2022 | Sold | $12,000-7.7% |
Source: Florida Gulf Coast MLS #221077956 Report a problem | ||
| 1/10/2022 | Pending sale | $13,000 |
Source:  Florida Gulf Coast MLS #221077956 Report a problem | ||
| 11/4/2021 | Listed for sale | $13,000-43% |
Source: Florida Gulf Coast MLS #221077956 Report a problem | ||
| 7/20/2004 | Sold | $22,800 |
Source: Public Record Report a problem | ||
Public tax history
| Year | Property taxes | Tax assessment |
|---|---|---|
| 2025 | $422 +11.6% | $12,064 +10% |
| 2024 | $378 +7.6% | $10,967 +6.3% |
| 2023 | $351 +24.8% | $10,313 +127.3% |
| 2022 | $281 +9.2% | $4,538 +10% |
| 2021 | $257 +1.6% | $4,125 +10% |
| 2020 | $254 +132.3% | $3,750 +1.4% |
| 2019 | $109 | $3,700 |
| 2018 | $109 +10.2% | $3,700 +23.8% |
| 2017 | $99 +9.8% | $2,988 -25.3% |
| 2016 | $90 -2.5% | $4,000 +37.9% |
| 2015 | $93 +11% | $2,900 +12.2% |
| 2014 | $83 +25.6% | $2,585 +23.1% |
| 2013 | $66 -12.3% | $2,100 -30% |
| 2012 | $76 -1.1% | $3,000 |
| 2011 | $76 -1.2% | $3,000 |
| 2010 | $77 -15.8% | $3,000 -25% |
| 2009 | $92 -45.3% | $4,000 -57% |
| 2008 | $168 -44.3% | $9,300 -47.2% |
| 2007 | $302 -56.2% | $17,600 -57.1% |
| 2006 | $689 +835.2% | $41,000 +1313.8% |
| 2004 | $74 +69.7% | $2,900 +123.1% |
| 2003 | $43 -1.7% | $1,300 |
| 2002 | $44 | $1,300 +30% |
| 2000 | -- | $1,000 |
Find assessor info on the county website
Monthly payment
Climate risks
Neighborhood: 33974


Similar homes
- $35,0000.28 acres1036 Manning Street E, Lehigh Acres, FL 33974Lot/Land

 MLS ID #B26070912, Kimberly Graham, LoKation. BeachesMLS
- $17,5000.25 acres311 Dill Ave, Lehigh Acres, FL 33974Lot/Land

 MLS ID #2026045513, Joann Carrion, Magna Realty, LLC. Florida Gulf Coast MLS
- $32,50010,018 sqft449 NAPLES AVE S, LEHIGH ACRES, FL 33974Lot/Land
 MLS ID #226025406, Salomon J Cardenas, Florida Global Professional. SWFLMLS
- $22,95010,018 sqft1042 Summa Boulevard, Lehigh Acres, FL 33974Lot/Land
 MLS ID #B26022622, Melanie Dicks, Coldwell Banker Splendor Realty. BeachesMLS
- $32,00010,018 sqft854 Jaguar Blvd, Lehigh Acres, FL 33974New ConstructionMLS ID #2026017017, Rossy Roche, EXP Realty LLC. Florida Gulf Coast MLS
- $27,00010,188 sqft551 Barranger AVE S, LEHIGH ACRES, FL 33974Lot/LandMLS ID #226032909, Ana Perez Leiva, VIA Realty, LLC. SWFLMLS
- $29,99910,018 sqft515 Grant Blvd, Lehigh Acres, FL 33974Lot/LandMLS ID #2026031850, Moe Mossa, Savvy Avenue, LLC. Florida Gulf Coast MLS
- $29,99910,018 sqft519 Grant Blvd, Lehigh Acres, FL 33974Lot/LandMLS ID #2026031848, Moe Mossa, Savvy Avenue, LLC. Florida Gulf Coast MLS
- $34,90010,624 sqft1114 Rachel St E, Lehigh Acres, FL 33974Lot/LandMLS ID #225049590, Dean Miskic, Pelican Vista Realty. Florida Gulf Coast MLS
- $27,0000.29 acres1033 Parker CT, LEHIGH ACRES, FL 33974Lot/LandMLS ID #226016934, Jordaan Sieben, PA, REMAX Affinity Mercato. SWFLMLS
- $33,9990.29 acres1063 Binkley St E, Lehigh Acres, FL 33974Lot/LandMLS ID #224065333, Kat Sanchez, Starlink Realty, Inc. Florida Gulf Coast MLS
- $31,90010,624 sqft1244 Echard St E, Lehigh Acres, FL 33974Lot/LandMLS ID #225004518, Idalmys Gonzalez, Premiere Plus Realty Company. Florida Gulf Coast MLS
- $29,0000.26 acresLehigh Acres, Lehigh Acres, FL 33974Lot/Land
 MLS ID #A11837922, Erika Hinton, Arinton Realty, LLC. MIAMI
- $23,9990.25 acres649 Ironwood Ave S, Lehigh Acres, FL 33974Lot/LandMLS ID #2026031897, Tracey Mayer Brooks, Experience Real Estate Group. Florida Gulf Coast MLS
- $16,00010,001 sqft639 Muldoon Ave S, Lehigh Acres, FL 33974Lot/LandMLS ID #2026039175, Lisa Jackson, Century 21 Selling Paradise. Florida Gulf Coast MLS
- $21,00010,249 sqft852 Carpenter ST E, LEHIGH ACRES, FL 33974Lot/LandMLS ID #226010351, Philippe Aguirre, Starlink Realty, Inc. SWFLMLS
- $25,00010,001 sqft897 Barcia St E, Lehigh Acres, FL 33974Lot/LandMLS ID #2026038561, Donna Martin, Always Island Time Realty LLC. Florida Gulf Coast MLS
- $20,0000.28 acres1231 RAMUS STREET E LOT 18, LEHIGH ACRES, FL 33974Lot/Land
 MLS ID #TB8502141, Neidre Hines, HOME GIRLS & GUYS REALTY. Stellar MLS
- $27,5000.28 acres434 Progress Ave, Lehigh Acres, FL 33974Lot/LandMLS ID #2026034971, Tina Chan, Alvarado Realty Group, LLC. Florida Gulf Coast MLS
- $30,0000.27 acres134 Bell BLVD S, LEHIGH ACRES, FL 33974Lot/LandMLS ID #226008136, Molly Lira, Key & Legacy Realty LLC. SWFLMLS
