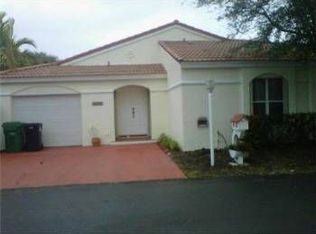
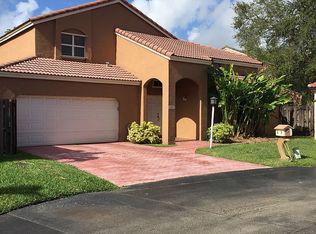
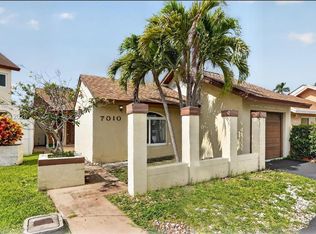
This 1350 square foot single family home has 3 bedrooms and 2.0 bathrooms. This home is located at 10969 SW 73rd Ter, Miami, FL 33173.
Foreclosed
Est. $587,300
10969 SW 73rd Ter, Miami, FL 33173
3beds
1,350sqft
SingleFamily
Built in 1989
3,619 Square Feet Lot
$587,300 Zestimate®
$435/sqft
$80/mo HOA
Overview
- 468 days |
- 39 |
- 1 |
Facts & features
Interior
Bedrooms & bathrooms
- Bedrooms: 3
- Bathrooms: 2
- Full bathrooms: 2
Heating
- Electric
Cooling
- Central
Appliances
- Included: Dishwasher, Dryer, Garbage disposal, Range / Oven, Refrigerator
Features
- First Floor Entry
- Flooring: Tile
Interior area
- Total interior livable area: 1,350 sqft
Property
Parking
- Total spaces: 4
- Parking features: Garage
Features
- Exterior features: Stucco
Lot
- Size: 3,619 Square Feet
Details
- Parcel number: 3040310400160
Construction
Type & style
- Home type: SingleFamily
Materials
- Roof: Tile
Condition
- Year built: 1989
Community & HOA
HOA
- Has HOA: Yes
- HOA fee: $80 monthly
Location
- Region: Miami
Financial & listing details
- Price per square foot: $435/sqft
- Tax assessed value: $436,123
- Annual tax amount: $4,777
Visit our professional directory to find a foreclosure specialist in your area that can help with your home search.
Find a foreclosure agentForeclosure details
Estimated market value
$587,300
$558,000 - $617,000
$3,338/mo
Price history
| Date | Event | Price |
|---|---|---|
| 3/24/2025 | Sold | $451,400+30.5%$334/sqft |
Source: Public Record Report a problem | ||
| 5/23/2019 | Sold | $346,000$256/sqft |
Source: Public Record Report a problem | ||
| 1/23/2019 | Sold | $346,000-3.6%$256/sqft |
Source: Agent Provided Report a problem | ||
| 12/10/2018 | Pending sale | $359,000$266/sqft |
Source: Real Estate Empire Group, Inc. #A10561288 Report a problem | ||
| 11/21/2018 | Price change | $359,000-2.7%$266/sqft |
Source: Real Estate Empire Group, Inc. #A10561288 Report a problem | ||
| 10/26/2018 | Listed for sale | $369,000+110.9%$273/sqft |
Source: Real Estate Empire Group, Inc. #A10561288 Report a problem | ||
| 1/24/2012 | Sold | $175,000-47.8%$130/sqft |
Source: Public Record Report a problem | ||
| 10/14/2011 | Listing removed | $335,500$249/sqft |
Source: eUhis.com Report a problem | ||
| 8/7/2011 | Price change | $335,500+91.7%$249/sqft |
Source: eUhis.com Report a problem | ||
| 5/18/2011 | Price change | $175,000-47.8%$130/sqft |
Source: AmeriFirst Realty of Florida #M1456970 Report a problem | ||
| 3/12/2011 | Listed for sale | $335,500+84.8%$249/sqft |
Source: eUhis.com Report a problem | ||
| 1/15/2011 | Listing removed | $181,500$134/sqft |
Source: AmeriFirst Realty of Florida #M1456970 Report a problem | ||
| 1/6/2011 | Price change | $181,500-2.4%$134/sqft |
Source: AmeriFirst Realty of Florida #M1456970 Report a problem | ||
| 1/2/2011 | Listed for sale | $185,900-19.5%$138/sqft |
Source: AmeriFirst Realty of Florida #M1347954 Report a problem | ||
| 10/8/2010 | Listing removed | $230,900$171/sqft |
Source: AMERIFIRST REALTY OF FLORIDA #M1347954 Report a problem | ||
| 6/20/2010 | Listed for sale | $230,900-31.9%$171/sqft |
Source: AMERIFIRST REALTY OF FLORIDA #M1347954 Report a problem | ||
| 2/20/2007 | Sold | $339,000+126%$251/sqft |
Source: Public Record Report a problem | ||
| 10/18/2001 | Sold | $150,000$111/sqft |
Source: Public Record Report a problem | ||
Public tax history
| Year | Property taxes | Tax assessment |
|---|---|---|
| 2025 | $4,777 +2.8% | $281,297 +2.9% |
| 2024 | $4,648 +5.9% | $273,370 +3% |
| 2023 | $4,388 +4.1% | $265,408 +3% |
| 2022 | $4,213 +0.7% | $257,678 +3% |
| 2021 | $4,183 -0.7% | $250,173 -0.4% |
| 2020 | $4,213 +52.6% | $251,075 +49% |
| 2019 | $2,760 +5.2% | $168,469 +1.9% |
| 2018 | $2,623 | $165,328 +2.1% |
| 2017 | $2,623 +0.9% | $161,928 +2.1% |
| 2016 | $2,599 +0.3% | $158,598 +0.7% |
| 2015 | $2,592 -1.1% | $157,496 +0.8% |
| 2014 | $2,620 -20.7% | $156,247 +1.5% |
| 2013 | $3,306 | $153,938 -0.6% |
| 2012 | $3,306 -4.5% | $154,868 -4.2% |
| 2011 | $3,463 +12.7% | $161,581 -4.2% |
| 2010 | $3,074 -2.9% | $168,723 -8.2% |
| 2009 | $3,166 +29.3% | $183,754 +69.8% |
| 2007 | $2,448 -4.2% | $108,213 |
| 2006 | $2,556 | -- |
| 2005 | $2,556 +1.7% | -- |
| 2004 | $2,513 +6.1% | -- |
| 2003 | $2,369 +17% | -- |
| 2002 | $2,025 | -- |
| 2001 | $2,025 | -- |
Find assessor info on the county website
Monthly payment
Estimated monthly payment$1,822
All calculations are estimates and provided by Zillow, Inc. for informational purposes only. Actual amounts may vary.
HOA fees may include property taxes on listings classified as Co-Ops. Contact the listing agent and/or owner for fee details.
Mortgage interest rates are dependent on a number of factors, including credit score, down payment, and repayment length. Interest rate data provided by Zillow Group Marketplace, Inc. as of 1/1/1970 from various mortgage lenders with which we have lead or other similar arrangements; the Estimated Payment is an average of those rates.
See how much you could borrow to make a competitive offer.
Climate risks
Neighborhood: Kendall
Nearby schools
GreatSchools rating
- 9/10Sunset Park Elementary SchoolGrades: PK-5Distance: 1 mi
- 8/10Glades Middle SchoolGrades: 6-8Distance: 1.6 mi
- 5/10Miami Killian Senior High SchoolGrades: 9-12Distance: 2.5 mi


- Florida
- Miami-Dade County
- Miami
- 33173
- Kendall
- 10969 SW 73rd Ter
Nearby cities
Nearby neighborhoods
Nearby zip codes
Other Miami Topics
