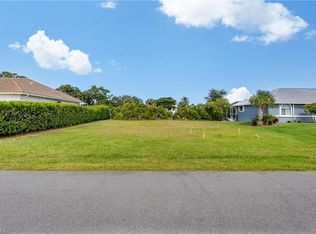
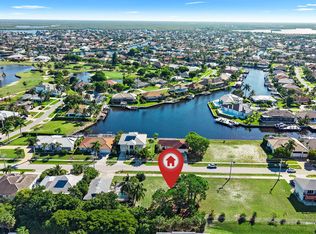
Build Ready Lot with Western Exposure! This centrally located, vacant lot provides an excellent opportunity to build your dream home with approximate dimensions of 73' (front) x 110' x 87' (back) x 110'. It is ideally situated in close proximity to local amenities, shopping, dining, and the stunning beaches of Marco Island. Don't miss this chance to own a piece of paradise in a desirable community.
Lot/land
$439,000
110 Delbrook Way, Marco Island, FL 34145
--beds
--baths
8,712Square Feet
Land, Unimproved Land
Built in ----
8,712 Square Feet Lot
$-- Zestimate®
$--/sqft
$-- HOA
What's special
Western exposureCentrally located
- 7 days
- 135
- 16
Zillow last checked:
Listing updated:
Listed by:
Jeremy Dixon 270-860-6293,
Premiere Plus Realty Company
Source: Marco Multi List,MLS#: 2261785
Facts & features
Property
Features
- Fencing: None
- View description: None
- Waterfront features: None
Lot
- Size: 8,712 Square Feet
- Dimensions: 73 x 110 x 87 x 110
- Features: City Lot, Mid Street Location
- Residential vegetation: Grassed
Details
- Parcel number: 59025480009
Utilities & green energy
- Sewer: Sewer Central
- Water: Public
- Utilities for property: Trash Removal
Community & HOA
Community
- Subdivision: Marco Beach Unit 25
HOA
- Has HOA: No
- Amenities included: None
Location
- Region: Marco Island
Financial & listing details
- Tax assessed value: $317,584
- Annual tax amount: $2,156
- Date on market: 10/17/2026
- Listing terms: At Close,Buyer Obtain Mortgage,Cash
- Road surface type: Paved
Estimated market value
Not available
Estimated sales range
Not available
Not available
Price history
| Date | Event | Price |
|---|---|---|
| 10/17/2026 | Listed for sale | $439,000 |
Source:  SWFLMLS #226037799 Report a problem | ||
Public tax history
| Year | Property taxes | Tax assessment |
|---|---|---|
| 2025 | $2,157 -7.8% | $166,811 +10% |
| 2024 | $2,339 +16.7% | $151,646 +10% |
| 2023 | $2,004 +18.9% | $137,860 +10% |
| 2022 | $1,686 +35.1% | $125,327 +10% |
| 2021 | $1,247 +11.9% | $113,934 +10% |
| 2020 | $1,115 -10% | $103,576 -4.4% |
| 2019 | $1,238 +14.3% | $108,330 +10% |
| 2018 | $1,083 | $98,482 -6% |
| 2017 | $1,083 -14.4% | $104,782 +10% |
| 2016 | $1,265 +13.1% | $95,256 +10% |
| 2015 | $1,118 +11.3% | $86,596 +5.4% |
| 2014 | $1,004 +14% | $82,181 +10% |
| 2013 | $881 -16.5% | $74,710 -15.4% |
| 2012 | $1,055 +0.6% | $88,294 |
| 2011 | $1,049 -24.6% | $88,294 -25.7% |
| 2010 | $1,392 -2.3% | $118,857 -2.8% |
| 2009 | $1,425 | $122,253 -10% |
| 2008 | $1,425 -49.8% | $135,837 -20% |
| 2007 | $2,838 +34.7% | $169,796 -31.5% |
| 2006 | $2,106 | $247,902 +44.6% |
| 2005 | $2,106 +53.9% | $171,494 +57.8% |
| 2004 | $1,368 +27.1% | $108,669 +30.6% |
| 2003 | $1,076 +20.2% | $83,200 +22.5% |
| 2002 | $895 -11.3% | $67,918 +81.8% |
| 2001 | $1,009 +192.3% | $37,355 |
| 2000 | $345 | -- |
Find assessor info on the county website
Monthly payment
Climate risks
Neighborhood: 34145

Similar homes
- $500,0000.29 acres1414 Delbrook WAY, MARCO ISLAND, FL 34145Lot/Land
 MLS ID #226036917, Mike O'Rourke, III, Re/Max Alliance Group. SWFLMLS
- $475,0008,712 sqft150 Greenview St, Marco Island, FL 34145Lot/Land
 MLS ID #2261769, Deborah Christensen, Premiere Plus Realty Company. Marco Multi List
- $599,0009,583 sqft128 Sand Hill St, Marco Island, FL 34145Lot/Land
 MLS ID #2242183, Krystal Bernhardt, Premiere Plus Realty Company. Marco Multi List
- $424,90010,018 sqft1201 6th AVE, MARCO ISLAND, FL 34145Lot/Land
 MLS ID #226009445, Diana Figurelli, Keller Williams Marco Realty. SWFLMLS
- $630,0008,712 sqft1318 Freeport Ave, Marco Island, FL 34145Lot/Land
 MLS ID #2026001494, Robert Arnold, Sand Dollar Realty Group Inc. Florida Gulf Coast MLS
- $298,0009,147 sqft118 1st Ave, Marco Island, FL 34145Lot/LandMLS ID #2026011088, Jim McCabe, Gulf Gateway Realty, Inc.. Florida Gulf Coast MLS
- $550,0003,049 sqft13431 Snook CIR, NAPLES, FL 34114Lot/LandMLS ID #226038134, Rosa Byrnes-Warfsman, Berkshire Hathaway FL Realty. SWFLMLS
- $400,000-- sqft4593 Southern Breeze DR, NAPLES, FL 34114Lot/LandMLS ID #226034326, Shelley Freshwater, Motorcoach Resort Realty, Inc. SWFLMLS
- $339,000-- sqft4609 Southern Breeze DR, NAPLES, FL 34114Lot/LandMLS ID #226034348, Shelley Freshwater, Motorcoach Resort Realty, Inc. SWFLMLS
- $239,000-- sqft1282 Silver Lakes BLVD, NAPLES, FL 34114Lot/LandMLS ID #226036178, Robyn Jones, Silver Lakes Realty, Inc. SWFLMLS
- $479,5006,534 sqft4620 Southern Breeze DR, NAPLES, FL 34114Lot/LandMLS ID #226004606, Shane Mazurek, MAZ REALTY GROUP LLC. SWFLMLS
- $450,0002.73 acresXXXX 13th ave sw, NAPLES, FL 34116Lot/LandMLS ID #226036025, Carlos Ramirez Hernandez, PA, Marzucco Real Estate. SWFLMLS
- $299,900-- sqft4669 Southern Breeze DR, NAPLES, FL 34114Lot/LandMLS ID #226034437, Shelley Freshwater, Motorcoach Resort Realty, Inc. SWFLMLS
- $475,000-- sqft4400 Southern Breeze DR, NAPLES, FL 34114Lot/LandMLS ID #226031942, Shelley Freshwater, Motorcoach Resort Realty, Inc. SWFLMLS
