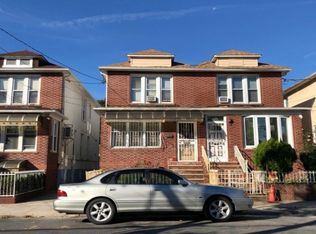
Prime Canarsie Investment Opportunity! Located in a residential neighborhood of Brooklyn, this property offers convenient access to local shopping, restaurants, schools, and public transportation, including the L train and B6, B7, and B8 bus routes. Enjoy nearby parks and recreational facilities, including Canarsie Park. This property presents excellent potential for investors, contractors, or buyers looking to renovate and customize a home to their own vision. The house requires work and is being sold "AS IS". The seller is seeking an all-cash buyer. Bring your vision and unlock the potential of this investment opportunity!
Active
$608,000
1107 E 92nd St, Brooklyn, NY 11236
4beds
1,427sqft
Multi Family
Built in 1950
-- sqft lot
$631,800 Zestimate®
$426/sqft
$-- HOA
What's special
- 23 days
- 2,481
- 98
Zillow last checked:
Listing updated:
Listed by:
REMAX Elite 646-261-1228,
Eric Chan
Source: StreetEasy,MLS#: S1853971
Facts & features
Interior
Bedrooms & bathrooms
- Bedrooms: 4
- Bathrooms: 2
- Full bathrooms: 2
Features
- Has fireplace: No
Interior area
- Total structure area: 1,427
- Total interior livable area: 1,427 sqft
Property
Details
- Parcel number: 081800032
- Special conditions: Resale
Construction
Type & style
- Home type: MultiFamily
- Property subtype: Multi Family
Condition
- Year built: 1950
Community & HOA
Community
- Subdivision: Canarsie
Location
- Region: Brooklyn
Financial & listing details
- Price per square foot: $426/sqft
- Tax assessed value: $752,000
- Annual tax amount: $6,360
- Date on market: 10/20/2026
Estimated market value
$631,800
$600,000 - $663,000
$3,149/mo
Price history
| Date | Event | Price |
|---|---|---|
| 10/20/2026 | Listed for sale | $608,000$426/sqft |
Source:  BNYMLS #505482 Report a problem | ||
Public tax history
| Year | Property taxes | Tax assessment |
|---|---|---|
| 2025 | $6,360 +0.7% | $45,120 +16.4% |
| 2024 | $6,317 | $38,760 -17.8% |
| 2023 | -- | $47,160 +10.9% |
| 2022 | -- | $42,540 +18.6% |
| 2021 | -- | $35,880 +10.7% |
| 2020 | $5,358 +2% | $32,400 |
| 2019 | $5,251 -3.5% | $32,400 +24.5% |
| 2018 | $5,443 +8.8% | $26,021 +6% |
| 2017 | $5,004 +16.1% | $24,549 +4% |
| 2016 | $4,311 | $23,595 +6% |
| 2015 | $4,311 +67.5% | $22,260 +1.9% |
| 2014 | $2,574 | $21,841 +0.7% |
| 2013 | -- | $21,685 +6% |
| 2012 | -- | $20,458 +0% |
| 2011 | -- | $20,449 +6% |
| 2010 | -- | $19,292 +6% |
| 2009 | -- | $18,201 +0.7% |
| 2008 | -- | $18,071 +6% |
| 2007 | -- | $17,049 +0% |
| 2006 | -- | $17,041 +6% |
| 2005 | -- | $16,077 +6% |
| 2004 | -- | $15,168 +0.7% |
| 2003 | -- | $15,060 +6% |
| 2002 | -- | $14,208 +0% |
| 2001 | -- | $14,201 +6% |
| 2000 | -- | $13,398 |
Find assessor info on the county website
Monthly payment
Climate risks
Neighborhood: Canarsie


Similar homes
- $649,9994 bd2 ba1k sqft1038 Remsen Ave, Brooklyn, NY 11236For Sale
 MLS ID #2601393, Ragheb Mick Baig, Listing by: Robert DeFalco Realty, Inc.. SIBOR
- $649,9993 bd3 ba1.4k sqft665 Varkens Hook Rd, Brooklyn, NY 11236Active
 MLS ID #S1802045, Davidson Joseph, Listing by: Keller Williams Realty of Greater Nassau. StreetEasy
- $--3 bd2 ba1.1k sqft1191 E 96th St, Brooklyn, NY 11236Auction
 Auction.com 1
- $--3 bd2 ba1.9k sqft928 E 48th St, Brooklyn, NY 11203Auction
 Auction.com 2
- $769,9005 bd4 ba1.4k sqft9015 Krier Place, Brooklyn, NY 11236For Sale
 MLS ID #1027399, Roy Shalom, Listing by: Family Homes Realty Group. OneKey® MLS as distributed by MLS GRID
- $679,0003 bd2 ba1.3k sqft1286 E 49th Street, Brooklyn, NY 11234For SaleMLS ID #1052447, Derek O. Cornwall, Listing by: Fave Realty Inc. OneKey® MLS as distributed by MLS GRID
- $599,0003 bd2 ba1.2k sqft23-29 95th Street, East Elmhurst, NY 11369For SaleMLS ID #1047257, Donovan Bailey, Listing by: Coldwell Banker American Homes. OneKey® MLS as distributed by MLS GRID
- $890,0005 bd3 ba1.5k sqft1375 E 101st Street, Brooklyn, NY 11236For SaleMLS ID #1019948, Sandra V. Morrison, Listing by: Century 21 Milestone Team Rlty. OneKey® MLS as distributed by MLS GRID
