Beautifully remodeled 3-bedroom, 2-bathroom home offering a fresh, updated look with plenty of charm. This inviting home features a comfortable layout and modern updates, making it a wonderful place to call home.
Pending
$188,000
1107 N Coleman St, Hobbs, NM 88240
3beds
1,207sqft
Single Family Residence
Built in 1954
6,098 Square Feet Lot
$182,200 Zestimate®
$156/sqft
$-- HOA
What's special
Modern updatesPlenty of charmFresh updated lookComfortable layoutInviting home
- 59 days
- 19
- 1
Zillow last checked:
Listing updated:
Listed by:
Sarah Tate 575-433-4000,
Nexus Real Estate 575-433-4000
Source: New Mexico MLS,MLS#: 26001175
Facts & features
Interior
Bedrooms & bathrooms
- Bedrooms: 3
- Bathrooms: 2
- Full bathrooms: 2
- Main level bedrooms: 3
Heating
- Has Heating (Unspecified Type)
Cooling
- Central Air
Features
- Ceiling Fan(s)
- Flooring: Laminate, Tile
- Has fireplace: No
Interior area
- Total structure area: 1,207
- Total interior livable area: 1,207 sqft
- Finished area above ground: 1,207
Property
Features
- Fencing: Fence
Lot
- Size: 6,098 Square Feet
- Topography: Fence
Details
- Parcel number: 4000121830001
Construction
Type & style
- Home type: SingleFamily
- Architectural style: Traditional
- Property subtype: Single Family Residence
Materials
- Frame
- Roof: Metal,Pitched
Condition
- Year built: 1954
Utilities & green energy
- Water: Water - City
- Utilities for property: Electricity Connected
Community & HOA
Community
- Security: Detector - Smoke/Heat
HOA
- Has HOA: No
Location
- Region: Hobbs
Financial & listing details
- Price per square foot: $156/sqft
- Tax assessed value: $63,333
- Annual tax amount: $1,652
- Date on market: 9/10/2026
- Listing agreement: Exclusive Right To Sell
- Listing terms: Cash,Conventional,FHA,VA Loan
- Inclusions: Free-Standing Range, Refrigerator
- Electric utility on property: Yes
Estimated market value
$182,200
$173,000 - $191,000
$1,909/mo
Price history
| Date | Event | Price |
|---|---|---|
| 10/2/2026 | Pending sale | $188,000$156/sqft |
Source:  New Mexico MLS #26001175 Report a problem | ||
| 9/10/2026 | Listed for sale | $188,000+18.3%$156/sqft |
Source: New Mexico MLS #26001175 Report a problem | ||
| 6/24/2026 | Listing removed | $158,900$132/sqft |
Source: New Mexico MLS #20233392 Report a problem | ||
| 3/29/2024 | Listing removed | -- |
Source: New Mexico MLS #20233392 Report a problem | ||
| 9/23/2023 | Listing removed | -- |
Source: Zillow Rentals Report a problem | ||
| 9/9/2023 | Listed for rent | $1,600$1/sqft |
Source: Zillow Rentals Report a problem | ||
| 7/24/2023 | Listing removed | $158,900$132/sqft |
Source: New Mexico MLS #20233392 Report a problem | ||
| 7/1/2023 | Listed for sale | $158,900+78.5%$132/sqft |
Source: New Mexico MLS #20233392 Report a problem | ||
| 5/5/2022 | Sold | -- |
Source: New Mexico MLS #20215469 Report a problem | ||
| 4/14/2022 | Contingent | $89,000$74/sqft |
Source: New Mexico MLS #20215469 Report a problem | ||
| 3/30/2022 | Listed for sale | $89,000$74/sqft |
Source: New Mexico MLS #20215469 Report a problem | ||
| 3/8/2022 | Listing removed | -- |
Source: New Mexico MLS #20215469 Report a problem | ||
| 1/24/2022 | Listed for sale | $89,000$74/sqft |
Source: New Mexico MLS #20215469 Report a problem | ||
| 1/1/2022 | Listing removed | -- |
Source: New Mexico MLS #20215469 Report a problem | ||
| 11/9/2021 | Price change | $89,000-11%$74/sqft |
Source: New Mexico MLS #20215469 Report a problem | ||
| 10/9/2021 | Listed for sale | $100,000$83/sqft |
Source: New Mexico MLS #20215469 Report a problem | ||
Public tax history
| Year | Property taxes | Tax assessment |
|---|---|---|
| 2025 | $570 -1.2% | $21,111 |
| 2024 | $577 -1.3% | $21,111 |
| 2023 | $585 +72.8% | $21,111 +70.6% |
| 2022 | $338 +3.3% | $12,373 +3% |
| 2021 | $328 +4.6% | $12,012 +3% |
| 2020 | $313 +4.8% | $11,662 +3% |
| 2019 | $299 +4.1% | $11,323 +3% |
| 2018 | $287 -12.4% | $10,993 -65.7% |
| 2017 | $328 +23.7% | $32,019 +3% |
| 2016 | $265 | $31,086 +3% |
| 2015 | $265 | $30,180 +3% |
| 2014 | -- | $29,301 -46.8% |
| 2013 | -- | $55,098 +3% |
| 2012 | -- | $53,493 +3% |
| 2011 | -- | $51,936 +3% |
| 2010 | -- | $50,421 |
Find assessor info on the county website
Monthly payment
Est. payment
Payment breakdown
Explore the cost of this home by adjusting the details. Changes won't be saved.Climate risks
Neighborhood: 88240

Similar homes
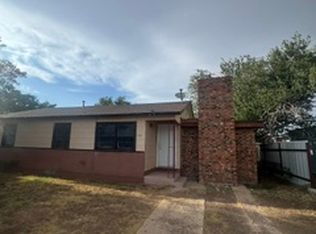
- $170,0004 bd2 ba1.2k sqft1206 W Clinton St, Hobbs, NM 88240For Sale
 MLS ID #26001104, Eric Leyva. New Mexico MLS
- $--3 bd1 ba1.1k sqft1402 N Gulf St, Hobbs, NM 88240Auction
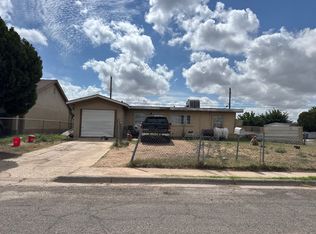 Auction.com 1
- $180,0003 bd2 ba1.6k sqft1527 N Breckon Dr, Hobbs, NM 88240For Sale
 MLS ID #26000273, Aaron Benavides. New Mexico MLS
- $180,0003 bd2 ba1.4k sqft1706 N Brazos Ave, Hobbs, NM 88240For Sale
 MLS ID #26000577, Rose Sanchez. New Mexico MLS
