Welcome to 111 Kings Dr! This 3-bedroom, 2-bath home offers a great location in Thomasville, convenient to Downtown, shopping, dining, the Thomasville Rose Garden and Cherokee Lake Park. The home is ready to be lived in as it sits, while still leaving plenty of room for you to update it and make it your own over time. It features a spacious living area, covered parking and a nice yard with mature trees. If you're looking for a home where you don't have to take on a complete renovation before moving in, but still want the freedom to remodel and add your own style, this could be the one. Offered at $175,000. The seller is open to reviewing reasonable offers, so come take a look!
For sale
$175,000
111 Kings Dr, Thomasville, GA 31792
3beds
1,107sqft
Single Family Residence
Built in 1987
0.25 Acres Lot
$-- Zestimate®
$158/sqft
$-- HOA
What's special
Covered parking
- 39 days
- 407
- 30
Zillow last checked:
Listing updated:
Listed by:
Danny Rojas Perez,
Lock & Key Realty
Source: Moultrie BOR,MLS#: 915931
Facts & features
Interior
Bedrooms & bathrooms
- Bedrooms: 3
- Bathrooms: 2
- Full bathrooms: 2
Interior area
- Total structure area: 1,107
- Total interior livable area: 1,107 sqft
Property
Features
- Levels: One
- Stories: 1
Lot
- Size: 0.25 Acres
Details
- Parcel number: 010009014
Construction
Type & style
- Home type: SingleFamily
- Property subtype: Single Family Residence
Condition
- Year built: 1987
Utilities & green energy
- Electric: City
- Water: City
Community & HOA
Community
- Subdivision: No Recorded Subdivision
Location
- Region: Thomasville
Financial & listing details
- Price per square foot: $158/sqft
- Tax assessed value: $148,669
- Annual tax amount: $1,395
- Date on market: 9/16/2026
Estimated market value
Not available
Estimated sales range
Not available
$1,489/mo
Price history
| Date | Event | Price |
|---|---|---|
| 9/16/2026 | Listed for sale | $175,000+75%$158/sqft |
Source: Moultrie BOR #915931 Report a problem | ||
| 3/26/2020 | Sold | $100,000-13%$90/sqft |
Source: Public Record Report a problem | ||
| 2/26/2020 | Pending sale | $114,900$104/sqft |
Source: Rose City Realty, Inc. #914909 Report a problem | ||
| 2/4/2020 | Price change | $114,900-5.4%$104/sqft |
Source: Rose City Realty, Inc. #914909 Report a problem | ||
| 12/10/2019 | Price change | $121,500-4.3%$110/sqft |
Source: Rose City Realty, Inc. #914909 Report a problem | ||
| 11/5/2019 | Price change | $126,900-0.5%$115/sqft |
Source: Rose City Realty, Inc. #914909 Report a problem | ||
| 9/19/2019 | Listed for sale | $127,500+102.4%$115/sqft |
Source: Rose City Realty, Inc. #914909 Report a problem | ||
| 4/23/2019 | Sold | $63,000-8.6%$57/sqft |
Source: Public Record Report a problem | ||
| 3/29/2019 | Pending sale | $68,900$62/sqft |
Source: Rose City Realty, Inc. #913787 Report a problem | ||
| 1/8/2019 | Listed for sale | $68,900$62/sqft |
Source: Rose City Realty, Inc. #913787 Report a problem | ||
| 12/1/2018 | Listing removed | $68,900$62/sqft |
Source: Whigham Realty LLC #7541 Report a problem | ||
| 8/31/2018 | Listed for sale | $68,900-8.1%$62/sqft |
Source: Whigham Realty LLC #7541 Report a problem | ||
| 12/31/2017 | Listing removed | $75,000$68/sqft |
Source: KeySouth Real Estate Group, Inc #908859 Report a problem | ||
| 4/28/2017 | Listed for sale | $75,000$68/sqft |
Source: KeySouth Real Estate Group, Inc #908859 Report a problem | ||
| 4/7/2017 | Pending sale | $75,000$68/sqft |
Source: KeySouth Real Estate Group, Inc #908859 Report a problem | ||
| 4/21/2016 | Listed for sale | $75,000$68/sqft |
Source: KeySouth Real Estate Group, Inc #908859 Report a problem | ||
| 4/11/2016 | Pending sale | $75,000$68/sqft |
Source: KeySouth Real Estate Group, Inc #908859 Report a problem | ||
| 11/13/2015 | Listed for sale | $75,000$68/sqft |
Source: KeySouth Real Estate Group, Inc #908859 Report a problem | ||
Public tax history
| Year | Property taxes | Tax assessment |
|---|---|---|
| 2025 | $1,395 +7.6% | $59,468 +3.6% |
| 2024 | $1,296 -0.2% | $57,391 +8.2% |
| 2023 | $1,299 +10.3% | $53,065 +14.6% |
| 2022 | $1,178 +6.8% | $46,299 +16.9% |
| 2021 | $1,103 +51.2% | $39,602 +4.5% |
| 2020 | $730 -14.8% | $37,888 +30.8% |
| 2019 | $856 +40% | $28,971 +1% |
| 2018 | $612 +2.4% | $28,690 +1.8% |
| 2017 | $597 +119.5% | $28,178 +1.7% |
| 2016 | $272 +0.8% | $27,717 -0.3% |
| 2015 | $270 +1.7% | $27,809 +2% |
| 2014 | $266 | $27,256 +0% |
| 2013 | $266 | $27,255 |
| 2012 | -- | -- |
| 2011 | -- | -- |
| 2010 | -- | -- |
| 2009 | -- | -- |
Find assessor info on the county website
Monthly payment
Est. payment
Payment breakdown
Explore the cost of this home by adjusting the details. Changes won't be saved.Climate risks
Neighborhood: 31792
Similar homes
- $160,0003 bd-- ba1.3k sqft708 Marshall St, Thomasville, GA 31792For Sale
 MLS ID #12036304, James Brian Lameier, Cook Real Estate. My State MLS
- $179,5003 bd2 ba988 sqft120 3rd Ave, Thomasville, GA 31792For Sale
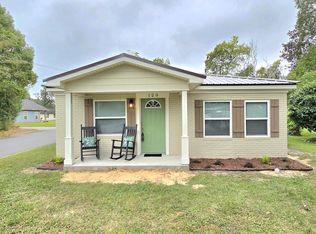 MLS ID #929432, Eugene Witherspoon. TABRMLS
- $165,0003 bd2 ba1.3k sqft120 Bosser Ave, Thomasville, GA 31792For Sale
 MLS ID #153417, Elisa Ray. South Georgia MLS
- $219,7503 bd2 ba1k sqft122 Royal Ave, Thomasville, GA 31792For Sale
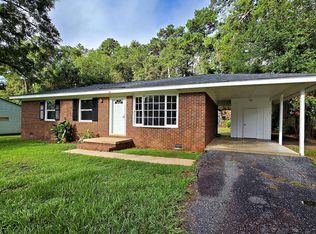 MLS ID #929111, Pamela Hoveland. TABRMLS
- $199,9993 bd2 ba1.2k sqft209 Henderson St, Thomasville, GA 31792Active
 MLS ID #10847254, Kitsi Garmon, C21 Avenues Real Estate Partners. GAMLS
