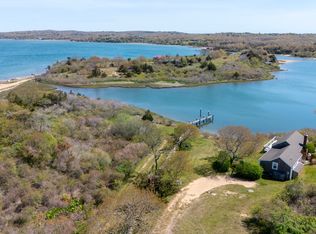
Surrounded by hundreds of acres of conservation-minded land, this private 4.3-acre parcel presents a rare opportunity to create a truly exceptional architectural masterpiece. Perched atop a high ridge, a three-bedroom home currently exists that commands panoramic water views across the Elizabeth Islands and Lamberts Cove. A gently winding walking path leads approximately 150 feet downhill to a beautiful, private sandy beach, creating an extraordinary connection between the homesite and the shoreline. With its remarkable privacy, expansive views, and direct access to the beach, this is a truly special opportunity to create a one-of-a-kind coastal retreat in an exceptional natural setting.
For sale
$7,200,000
111 Old Herring Creek Rd, West Tisbury, MA 02575
3beds
864sqft
Single Family Residence
Built in 1970
4.3 Acres Lot
$6,656,900 Zestimate®
$8,333/sqft
$-- HOA
What's special
Gently winding walking pathBeautiful private sandy beachExpansive viewsThree-bedroom home
- 35 days
- 254
- 10
Likely to sell faster than
Zillow last checked:
Listing updated:
Listed by:
Thomas Leclair,
Landvest MV
Source: LINK,MLS#: 44958
Facts & features
Interior
Bedrooms & bathrooms
- Bedrooms: 3
- Bathrooms: 1
- Full bathrooms: 1
Heating
- Electric
Features
- Flooring: Hardwood
Interior area
- Total structure area: 864
- Total interior livable area: 864 sqft
Property
Parking
- Parking features: Yes
Features
- Exterior features: PvtBch, Deck
- On waterfront: Yes
- Waterfront features: Waterfront
- Frontage type: Waterfront
Lot
- Size: 4.3 Acres
- Features: Yes
Details
- Parcel number: WTISM00006B00010L00000
- Zoning: RU
Construction
Type & style
- Home type: SingleFamily
- Property subtype: Single Family Residence
Condition
- Year built: 1970
Utilities & green energy
- Sewer: Septic Tank
- Water: Well
- Utilities for property: Cbl
Community & HOA
Location
- Region: West Tisbury
Financial & listing details
- Price per square foot: $8,333/sqft
- Tax assessed value: $8,428,700
- Annual tax amount: $37,462
- Date on market: 9/17/2026
- Listing agreement: E
Estimated market value
$6,656,900
$6.32M - $6.99M
Not available
Price history
| Date | Event | Price |
|---|---|---|
| 9/17/2026 | Listed for sale | $7,200,000-15.3%$8,333/sqft |
Source: LINK #44958 Report a problem | ||
| 10/15/2023 | Listing removed | $8,500,000$9,838/sqft |
Source: LINK #39791 Report a problem | ||
| 7/27/2023 | Listed for sale | $8,500,000-5.6%$9,838/sqft |
Source: LINK #39791 Report a problem | ||
| 2/12/2023 | Listing removed | $9,000,000$10,417/sqft |
Source: LINK #39791 Report a problem | ||
| 10/25/2022 | Price change | $9,000,000-10%$10,417/sqft |
Source: LINK #39791 Report a problem | ||
| 6/27/2022 | Listed for sale | $10,000,000+57%$11,574/sqft |
Source: LINK #39791 Report a problem | ||
| 2/15/2012 | Sold | $6,370,000-54.5%$7,373/sqft |
Source: LINK #22674 Report a problem | ||
| 1/2/2004 | Sold | $14,000,000$16,204/sqft |
Source: Public Record Report a problem | ||
Public tax history
| Year | Property taxes | Tax assessment |
|---|---|---|
| 2025 | $37,462 +8.6% | $8,269,700 +3.1% |
| 2024 | $34,502 | $8,023,800 +0.2% |
| 2023 | -- | $8,011,100 +16.4% |
| 2022 | $40,060 -2.8% | $6,883,100 +1.9% |
| 2021 | $41,199 +0.5% | $6,753,900 0% |
| 2020 | $41,005 -1.6% | $6,755,300 +0.2% |
| 2019 | $41,675 +5.2% | $6,743,500 +3.2% |
| 2018 | $39,616 -0.5% | $6,537,300 -2% |
| 2017 | $39,807 +3.8% | $6,667,800 +5.4% |
| 2016 | $38,351 +6.1% | $6,328,500 |
| 2015 | $36,136 +2.4% | $6,328,500 -3% |
| 2014 | $35,305 +2.9% | $6,525,800 |
| 2013 | $34,326 +6.9% | $6,525,800 |
| 2012 | $32,107 -4.2% | $6,525,800 -7.9% |
| 2011 | $33,502 +6% | $7,082,800 -0.1% |
| 2010 | $31,617 +4% | $7,089,000 -0.2% |
| 2009 | $30,403 +0.4% | $7,103,400 -3.9% |
| 2008 | $30,296 -5% | $7,389,300 +1.5% |
| 2007 | $31,880 -8.2% | $7,278,600 |
| 2006 | $34,719 +7.9% | $7,278,600 +2.2% |
| 2005 | $32,185 +14.8% | $7,120,500 +36.7% |
| 2004 | $28,034 +8.7% | $5,210,700 |
| 2003 | $25,793 | $5,210,700 |
Find assessor info on the county website
Monthly payment
Est. payment
Payment breakdown
Explore the cost of this home by adjusting the details. Changes won't be saved.Climate risks
Neighborhood: 02575
- $11,400,0004 bd4 ba2.4k sqft104 Old Herring Creek Rd W, Vineyard Haven, MA 02568For Sale
- $6,546,7001 bd1 ba776 sqft223 John Cottle Rd, Tisbury, MA 02568Off Market
- $10,118,300-- bd-- ba-- sqft135 Old Herring Creek Rd, West Tisbury, MA 02575Off Market
- $5,782,5005 bd4 ba3k sqft221 John Cottle Rd, Tisbury, MA 02568Off Market