Calling all investors! This partially finished quadplex is halfway there! Rent out the units on the west side of the building and put some sweat equity into the units on the east side for a multi-family that should rent for $650/unit per studio and more for the east side units. Start building your investment portfolio or add these doors to your current properties today!
Pending
$140,050
1113 Corby St, Saint Joseph, MO 64501
--beds
0baths
--sqft
Quadruplex
Built in 1885
-- sqft lot
$-- Zestimate®
$--/sqft
$-- HOA
What's special
Fresh paintHardwood floorsLarge units
- 692 days
- 77
- 3
Zillow last checked:
Listing updated:
Listed by:
Joshua Johnson 757-270-0946,
BHHS Stein & Summers Real Estate
Source: Heartland MLS as distributed by MLS GRID,MLS#: 2523807
Facts & features
Interior
Bedrooms & bathrooms
- Bathrooms: 0
Heating
- Has Heating (Unspecified Type)
Cooling
- Window Unit(s)
Appliances
- Included: Water Heater
Features
- Has basement: Yes
Property
Parking
- Parking features: On Street
- Has uncovered spaces: Yes
Lot
- Size: 5,663 Square Feet
Details
- Parcel number: 063.008001002050.000
- Zoning: MF
Construction
Type & style
- Home type: MultiFamily
- Property subtype: Quadruplex
Materials
- Wood Siding
- Roof: Composition
Condition
- Year built: 1885
Utilities & green energy
- Sewer: Public Sewer
- Water: Public
Community & HOA
Community
- Subdivision: Other
HOA
- Has HOA: No
Location
- Region: Saint Joseph
Financial & listing details
- Tax assessed value: $46,410
- Annual tax amount: $429
- Date on market: 12/20/2024
- Listing terms: Cash,Conventional
Estimated market value
Not available
Estimated sales range
Not available
Not available
Price history
| Date | Event | Price |
|---|---|---|
| 11/9/2026 | Pending sale | $140,050 |
Source:  Heartland MLS as distributed by MLS GRID #2523807 Report a problem | ||
| 7/31/2026 | Price change | $140,050-5.1% |
Source: Heartland MLS as distributed by MLS GRID #2523807 Report a problem | ||
| 6/30/2026 | Listed for sale | $147,500-1% |
Source: Heartland MLS as distributed by MLS GRID #2523807 Report a problem | ||
| 6/16/2025 | Price change | $149,000-0.7% |
Source: Heartland MLS as distributed by MLS GRID #2523807 Report a problem | ||
| 2/1/2025 | Listed for sale | $150,000 |
Source: Heartland MLS as distributed by MLS GRID #2523807 Report a problem | ||
| 1/11/2025 | Pending sale | $150,000 |
Source: Heartland MLS as distributed by MLS GRID #2523807 Report a problem | ||
| 12/20/2024 | Listed for sale | $150,000+0.1% |
Source: Heartland MLS as distributed by MLS GRID #2523807 Report a problem | ||
| 2/21/2024 | Listing removed | -- |
Source: Heartland MLS as distributed by MLS GRID #2470442 Report a problem | ||
| 1/27/2024 | Listed for sale | $149,900+416.9% |
Source: Heartland MLS as distributed by MLS GRID #2470442 Report a problem | ||
| 7/7/2022 | Sold | -- |
Source: Heartland MLS as distributed by MLS GRID #2375596 Report a problem | ||
| 5/23/2022 | Pending sale | $29,000 |
Source: Heartland MLS as distributed by MLS GRID #2375596 Report a problem | ||
| 5/14/2022 | Listed for sale | $29,000 |
Source: Heartland MLS as distributed by MLS GRID #2375596 Report a problem | ||
| 4/23/2022 | Pending sale | $29,000 |
Source: Heartland MLS as distributed by MLS GRID #2375596 Report a problem | ||
| 4/22/2022 | Price change | $29,000-27.5% |
Source: Heartland MLS as distributed by MLS GRID #2375596 Report a problem | ||
| 4/18/2022 | Price change | $40,000-18.4% |
Source: Heartland MLS as distributed by MLS GRID #2375596 Report a problem | ||
| 4/14/2022 | Listed for sale | $49,000+63.9% |
Source: Heartland MLS as distributed by MLS GRID #2375596 Report a problem | ||
| 3/6/2022 | Listing removed | -- |
Source: Heartland MLS as distributed by MLS GRID #2363695 Report a problem | ||
| 2/2/2022 | Listed for sale | $29,900 |
Source: Heartland MLS as distributed by MLS GRID #2363695 Report a problem | ||
| 2/1/2022 | Listing removed | -- |
Source: Heartland MLS as distributed by MLS GRID #2353603 Report a problem | ||
| 1/13/2022 | Listed for sale | $29,900-39% |
Source: Heartland MLS as distributed by MLS GRID #2353603 Report a problem | ||
| 12/14/2021 | Sold | -- |
Source: Public Record Report a problem | ||
| 11/29/2021 | Price change | $49,000-38% |
Source: Heartland MLS as distributed by MLS GRID #2353603 Report a problem | ||
| 11/17/2021 | Price change | $79,000-7.1% |
Source: Heartland MLS as distributed by MLS GRID #2353603 Report a problem | ||
| 11/4/2021 | Listed for sale | $85,000 |
Source: Heartland MLS as distributed by MLS GRID #2353603 Report a problem | ||
Public tax history
| Year | Property taxes | Tax assessment |
|---|---|---|
| 2025 | $734 +23.8% | $8,820 +6.4% |
| 2024 | $593 +38.3% | $8,290 +27.1% |
| 2023 | $429 -0.7% | $6,520 |
| 2022 | $432 +12.1% | $6,520 +13% |
| 2021 | $385 +0.6% | $5,770 |
| 2020 | $383 +14.6% | $5,770 |
| 2018 | $334 | $5,770 |
| 2017 | $334 +1.1% | $5,770 |
| 2015 | $330 +165065% | $5,770 |
| 2014 | $0 | $5,770 -12.3% |
| 2012 | $405 +6.5% | $6,580 |
| 2011 | $381 | $6,580 +3% |
| 2010 | $381 | $6,390 |
Find assessor info on the county website
Monthly payment
Est. payment
Payment breakdown
Explore the cost of this home by adjusting the details. Changes won't be saved.Climate risks
Neighborhood: 64501
Similar homes
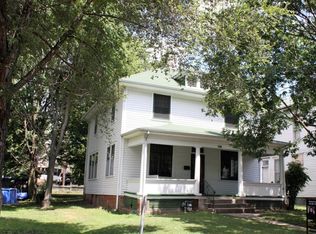
- $149,000-- bd-- ba-- sqft316 N 19th St, Saint Joseph, MO 64501For Sale
 MLS ID #2638764, Joshua Johnson, BHHS Stein & Summers Real Estate. Heartland MLS as distributed by MLS GRID
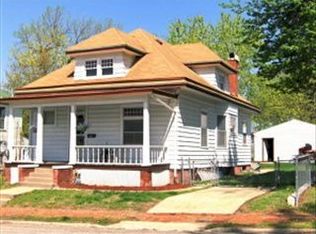
- $150,0003 bd2 ba1.4k sqft1023 Church St, Saint Joseph, MO 64501For Sale
 MLS ID #2650479, Michael Ashby, Coldwell Banker General Property. Heartland MLS as distributed by MLS GRID
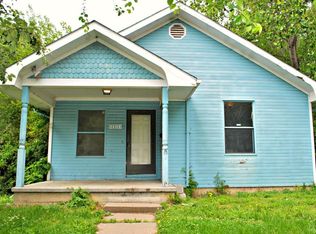
- $149,0004 bd3 ba3.2k sqft306 N 18th St, Saint Joseph, MO 64501For Sale
 MLS ID #2650773, Michael Ashby, Coldwell Banker General Property. Heartland MLS as distributed by MLS GRID
- $125,0003 bd2 ba734 sqft1321 Ridenbaugh St, Saint Joseph, MO 64501For Sale
 MLS ID #2617638, Joshua Johnson, BHHS Stein & Summers Real Estate. Heartland MLS as distributed by MLS GRID
