Quaint home in Old Town Escondido neighborhood situated on a large lot. The property needs updating, making it ideal for investors, contractors, or buyers seeking a project. Conveniently located near shopping, dining, and schools. A great opportunity to create value in a desirable neighborhood.
For sale
$535,000
1119 S Juniper St, Escondido, CA 92025
2beds
780sqft
Single Family Residence
Built in 1952
0.31 Acres Lot
$531,200 Zestimate®
$686/sqft
$-- HOA
What's special
Large lot
- 7 hours
- 181
- 15
Zillow last checked:
Listing updated:
Listed by:
John Notman Jr. DRE #01863100 858-378-3035,
John S Notman, Broker
Source: SDMLS,MLS#: 260025240 Originating MLS: SDMLS
Facts & features
Interior
Bedrooms & bathrooms
- Bedrooms: 2
- Bathrooms: 1
- Full bathrooms: 1
Heating
- N/K
Cooling
- N/K
Appliances
- Included: N/K
- Laundry: Washer Hookup
Features
- Flooring: Carpet, Linoleum/Vinyl, Wood
Interior area
- Total structure area: 780
- Total interior livable area: 780 sqft
Property
Parking
- Total spaces: 2
- Parking features: Attached
Features
- Levels: 1 Story
- Pool features: N/K
- Fencing: Partial
Lot
- Size: 0.31 Acres
Details
- Parcel number: 2335910500
- Zoning: R-1:SINGLE
- Zoning description: R-1:SINGLE
Construction
Type & style
- Home type: SingleFamily
- Property subtype: Single Family Residence
Materials
- Stucco
- Roof: Composition
Condition
- Year built: 1952
Utilities & green energy
- Sewer: Public Sewer
- Water: Public
Community & HOA
Community
- Subdivision: SOUTH ESCONDIDO
Location
- Region: Escondido
Financial & listing details
- Price per square foot: $686/sqft
- Tax assessed value: $49,886
- Date on market: 10/19/2026
- Listing terms: Cash
Estimated market value
$531,200
$505,000 - $558,000
$2,408/mo
Price history
| Date | Event | Price |
|---|---|---|
| 10/19/2026 | Listed for sale | $535,000$686/sqft |
Source:  SDMLS #260025240 Report a problem | ||
Public tax history
| Year | Property taxes | Tax assessment |
|---|---|---|
| 2026 | -- | $49,886 +2% |
| 2025 | $514 +2.6% | $48,908 +2% |
| 2024 | $501 +2.8% | $47,950 +2% |
| 2023 | $487 +1.5% | $47,010 +2% |
| 2022 | $480 +1.9% | $46,090 +2% |
| 2021 | $471 +0.7% | $45,188 +1% |
| 2020 | $468 +10.5% | $44,726 +2% |
| 2019 | $424 -4.2% | $43,850 +2% |
| 2018 | $442 +2.1% | $42,992 +2% |
| 2017 | $433 +2.6% | $42,150 +2% |
| 2016 | $422 +1.1% | $41,324 +1.5% |
| 2015 | $418 +4.2% | $40,704 +2% |
| 2014 | $401 | $39,908 +0.5% |
| 2013 | -- | $39,728 +2% |
| 2012 | -- | $38,950 +2% |
| 2011 | -- | $38,188 +0.7% |
| 2010 | -- | $37,904 -0.2% |
| 2009 | -- | $37,996 +2% |
| 2008 | -- | $37,252 +2% |
| 2007 | -- | $36,522 +2% |
| 2006 | -- | $35,806 +2% |
| 2005 | -- | $35,104 +2% |
| 2004 | -- | $34,416 +1.9% |
| 2003 | -- | $33,786 +2% |
| 2002 | -- | $33,124 +2% |
| 2001 | -- | $32,476 |
Find assessor info on the county website
Monthly payment
Est. payment
Payment breakdown
Explore the cost of this home by adjusting the details. Changes won't be saved.Climate risks
Neighborhood: Old Escondido Historic District


Similar homes
- $525,0002 bd1 ba858 sqft418 E Pennsylvania Ave, Escondido, CA 92025For Sale
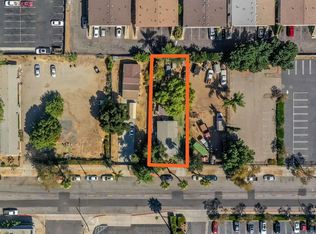 MLS ID #260022507, Alexander L Kohl, Bridgepoint Realty Inc. SDMLS
- $715,0002 bd1 ba720 sqft739 Park Pl, Escondido, CA 92025For Sale
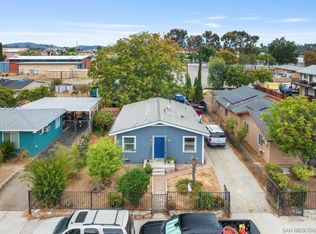 MLS ID #260024851, Ryan Khayamian, Bluxen, Inc.. SDMLS
- $675,0002 bd1 ba786 sqft530 S Kalmia St, Escondido, CA 92025For Sale
 MLS ID #NDP2607744, Crystal Stotler, Top Tier Property Management. CRMLS
- $575,0003 bd2 ba1.1k sqft350 E Pennsylvania Ave, Escondido, CA 92025For Sale
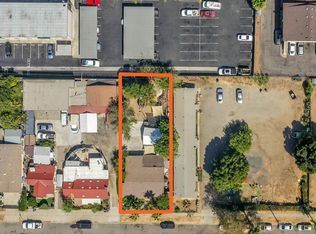 MLS ID #260022505, Alexander L Kohl, Bridgepoint Realty Inc. SDMLS
