Location, location location
For sale
Listed by: Juan Carlos Morales Broker • Juan Morales • Contact: 323-236-4469
Price cut: $50K (9/24)
$675,000
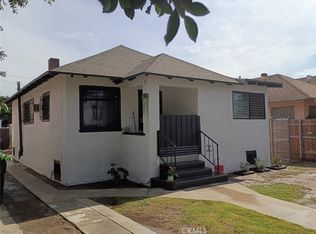
1123 E 57th St, Los Angeles, CA 90011
3beds
1,352sqft
Single Family Residence
Built in 1918
5,397 Square Feet Lot
$678,300 Zestimate®
$499/sqft
$-- HOA
What's special
- 34 days
- 168
- 19
Zillow last checked:
Listing updated:
Listed by:
Juan Morales DRE #00916712 323-236-4469,
Juan Carlos Morales Broker
Source: CRMLS,MLS#: RS26206108 Originating MLS: California Regional MLS
Facts & features
Interior
Bedrooms & bathrooms
- Bedrooms: 3
- Bathrooms: 3
- Full bathrooms: 3
- Main level bathrooms: 3
- Main level bedrooms: 3
Rooms
- Room types: Bedroom
Bedroom
- Features: All Bedrooms Down
Cooling
- Central Air
Appliances
- Laundry: None
Features
- Granite Counters, All Bedrooms Down
- Has fireplace: No
- Fireplace features: None
- Common walls with other units/homes: No Common Walls
Interior area
- Total interior livable area: 1,352 sqft
Property
Parking
- Total spaces: 1
- Parking features: Garage
- Garage spaces: 1
Features
- Levels: One
- Stories: 1
- Entry location: 1
- Pool features: None
Lot
- Size: 5,397 Square Feet
- Features: 0-1 Unit/Acre
Details
- Parcel number: 5104024010
- Special conditions: Standard
Construction
Type & style
- Home type: SingleFamily
- Property subtype: Single Family Residence
Condition
- New construction: No
- Year built: 1918
Utilities & green energy
- Sewer: Public Sewer
- Water: Public
Community & HOA
Community
- Features: Sidewalks
Location
- Region: Los Angeles
Financial & listing details
- Price per square foot: $499/sqft
- Tax assessed value: $263,200
- Date on market: 9/21/2026
- Cumulative days on market: 34 days
- Listing terms: Cash to New Loan
Estimated market value
$678,300
$644,000 - $712,000
$3,759/mo
Price history
| Date | Event | Price |
|---|---|---|
| 9/24/2026 | Price change | $675,000-6.9%$499/sqft |
Source:  CRMLS #RS26206108 Report a problem | ||
| 9/21/2026 | Listed for sale | $725,000+367.7%$536/sqft |
Source: CRMLS #RS26206108 Report a problem | ||
| 10/11/2002 | Sold | $155,000+6.6%$115/sqft |
Source: Public Record Report a problem | ||
| 2/21/2002 | Sold | $145,378+7.7%$108/sqft |
Source: Public Record Report a problem | ||
| 6/14/2000 | Sold | $135,000+23.6%$100/sqft |
Source: Public Record Report a problem | ||
| 9/24/1999 | Sold | $109,181-14.3%$81/sqft |
Source: Public Record Report a problem | ||
| 3/2/1999 | Sold | $127,359$94/sqft |
Source: Public Record Report a problem | ||
| 4/13/1998 | Sold | $127,359+10.7%$94/sqft |
Source: Public Record Report a problem | ||
| 10/16/1995 | Sold | $115,000+49.4%$85/sqft |
Source: Public Record Report a problem | ||
| 7/3/1995 | Sold | $77,000+43.9%$57/sqft |
Source: Public Record Report a problem | ||
| 3/28/1995 | Sold | $53,500+10.7%$40/sqft |
Source: Public Record Report a problem | ||
| 1/4/1995 | Sold | $48,333$36/sqft |
Source: Public Record Report a problem | ||
Public tax history
| Year | Property taxes | Tax assessment |
|---|---|---|
| 2026 | -- | $263,200 +2% |
| 2025 | $3,368 +1.5% | $258,053 +2% |
| 2024 | $3,318 +1.8% | $252,994 +2% |
| 2023 | $3,258 +4.7% | $248,034 +2% |
| 2022 | $3,112 +1.4% | $243,172 +2% |
| 2021 | $3,069 -0.9% | $238,405 +1% |
| 2020 | $3,096 | $235,962 +2% |
| 2019 | $3,096 +6.3% | $231,336 +2% |
| 2018 | $2,911 | $226,801 +2% |
| 2017 | $2,911 +2.2% | $222,355 +2% |
| 2016 | $2,848 +2.7% | $217,996 +1.5% |
| 2015 | $2,773 +0.8% | $214,722 +2% |
| 2014 | $2,751 | $210,517 +2.5% |
| 2012 | -- | $205,457 +2% |
| 2011 | -- | $201,429 +31.8% |
| 2010 | -- | $152,800 -23.8% |
| 2009 | -- | $200,401 +2% |
| 2008 | -- | $196,472 +2% |
| 2007 | -- | $192,620 +2% |
| 2006 | -- | $188,844 |
| 2005 | -- | $188,844 +4% |
| 2004 | -- | $181,513 +17.1% |
| 2003 | -- | $155,000 +10.4% |
| 2002 | -- | $140,453 +28.6% |
| 2000 | -- | $109,200 |
Find assessor info on the county website
Monthly payment
Est. payment
Payment breakdown
Explore the cost of this home by adjusting the details. Changes won't be saved.Climate risks
Neighborhood: Southeast Los Angeles

Similar homes
- $669,9003 bd3 ba1k sqft204 E 51st St, Los Angeles, CA 90011For Sale
 MLS ID #DW26229709, Luis Martinez, Century 21 Allstars. CRMLS
- $649,0004 bd3 ba1.3k sqft1302 E 48th Pl, Los Angeles, CA 90011For Sale
 MLS ID #PW26190998, Jared Nunez, Alchemy Realty Inc. CRMLS
- $670,0004 bd2 ba1.2k sqft1580 E 45th St, Los Angeles, CA 90011For Sale
 MLS ID #IG26182620, Lucas Smith, Sell My Home Real Estate. CRMLS
- $629,0004 bd2 ba1.3k sqft324 E 55th St, Los Angeles, CA 90011For Sale
 MLS ID #SR26222593, Thomas dell'Aria, Sunset Lending and Realty. CRMLS
