Lender incentive available: buy your rate down or get 1% toward closing costs. Contact for details.Welcome to 11300 Sand Bridge Ct in Bakersfield! This two-story home offers 4 bedrooms, 2.5 bathrooms, and 2,156 sq ft of living space on a roomy 9,148 sq ft lot. Built in 2005, it features a cozy fireplace, central air conditioning and forced-air heating, an indoor laundry room, and an attached 2-car garage. The living and dining areas give you plenty of space to gather or unwind. Come see it for yourself and schedule your showing today!
Active
$439,900
11300 Sand Bridge Ct, Bakersfield, CA 93312
4beds
3baths
2,156sqft
Single Family Residence
Built in 2005
9,147 Square Feet Lot
$435,900 Zestimate®
$204/sqft
$-- HOA
What's special
Cozy fireplaceIndoor laundry roomForced-air heatingCentral air conditioning
- 1 day
- 510
- 83
Likely to sell faster than
Zillow last checked:
Listing updated:
Listed by:
Ali Daredia DRE #02035436 661-903-3183 alex@sellkerncounty.com,
Watson Realty
Source: Bakersfield AOR,MLS#: 202612079
Facts & features
Interior
Bedrooms & bathrooms
- Bedrooms: 4
- Bathrooms: 3
Heating
- Central
Cooling
- Central Air
Features
- Number of fireplaces: 1
Interior area
- Total structure area: 2,156
- Total interior livable area: 2,156 sqft
Property
Parking
- Total spaces: 3
- Parking features: 3 Car Garage, RV Access/Parking
- Garage spaces: 3
Features
- Levels: Two
- Stories: 2
- Pool features: None
Lot
- Size: 9,147 Square Feet
- Features: Cul-De-Sac
Details
- Parcel number: 52734151
- Zoning: R-1
- Zoning description: R-1
- Special conditions: Standard
Construction
Type & style
- Home type: SingleFamily
- Property subtype: Single Family Residence
Condition
- Year built: 2005
Utilities & green energy
- Electric: PPA Solar
Community & HOA
Community
- Subdivision: Tract 6153 Unit 1
Location
- Region: Bakersfield
Financial & listing details
- Price per square foot: $204/sqft
- Tax assessed value: $441,630
- Date on market: 11/19/2026
Estimated market value
$435,900
$414,000 - $458,000
$2,841/mo
Price history
| Date | Event | Price |
|---|---|---|
| 11/19/2026 | Listed for sale | $439,900+7.8%$204/sqft |
Source:  Bakersfield AOR #202612079 Report a problem | ||
| 10/16/2026 | Listing removed | $2,495$1/sqft |
Source: Zillow Rentals Report a problem | ||
| 10/8/2026 | Listed for rent | $2,495$1/sqft |
Source: Zillow Rentals Report a problem | ||
| 2/25/2026 | Listing removed | $2,495$1/sqft |
Source: Zillow Rentals Report a problem | ||
| 2/11/2026 | Price change | $2,495-7.4%$1/sqft |
Source: Zillow Rentals Report a problem | ||
| 11/5/2025 | Listed for rent | $2,695$1/sqft |
Source: Zillow Rentals Report a problem | ||
| 6/21/2022 | Sold | $408,000-9.3%$189/sqft |
Source: Bakersfield AOR #202202972 Report a problem | ||
| 5/2/2022 | Pending sale | $450,000$209/sqft |
Source: Bakersfield AOR #202202972 Report a problem | ||
| 3/24/2022 | Listed for sale | $450,000+73.1%$209/sqft |
Source: Bakersfield AOR #202202972 Report a problem | ||
| 5/28/2014 | Sold | $260,000$121/sqft |
Source: Bakersfield AOR #21311860 Report a problem | ||
| 2/18/2014 | Sold | $260,000-1.9%$121/sqft |
Source: Agent Provided Report a problem | ||
| 11/30/2013 | Listed for sale | $265,000+39.5%$123/sqft |
Source: Coldwell Banker Preferred Realtors #21311860 Report a problem | ||
| 8/9/2010 | Sold | $190,000+0.1%$88/sqft |
Source: Public Record Report a problem | ||
| 7/6/2010 | Price change | $189,900-2.1%$88/sqft |
Source: Watson Touchstone ERA #21004023 Report a problem | ||
| 3/26/2010 | Listed for sale | $193,900-51%$90/sqft |
Source: foreclosure.com Report a problem | ||
| 10/28/2009 | Sold | $395,591+0.1%$183/sqft |
Source: Public Record Report a problem | ||
| 1/19/2006 | Sold | $395,000+59.6%$183/sqft |
Source: Public Record Report a problem | ||
| 9/21/2005 | Sold | $247,500$115/sqft |
Source: Public Record Report a problem | ||
Public tax history
| Year | Property taxes | Tax assessment |
|---|---|---|
| 2026 | -- | $441,630 +2% |
| 2025 | $6,119 +1.5% | $432,971 +2% |
| 2024 | $6,029 +2.2% | $424,483 +2% |
| 2023 | $5,902 +28% | $416,160 +38.6% |
| 2022 | $4,611 | $300,332 +2% |
| 2021 | -- | $294,444 +1% |
| 2020 | $4,461 +1.6% | $291,426 |
| 2019 | $4,391 +2.4% | $291,426 +4% |
| 2018 | $4,290 +1.5% | $280,112 +2% |
| 2017 | $4,227 +5.9% | $274,621 +2% |
| 2016 | $3,992 +1.3% | $269,237 +1.5% |
| 2015 | $3,940 +23.2% | $265,194 +33.6% |
| 2014 | $3,197 | $198,572 +0.5% |
| 2013 | -- | $197,676 +10.4% |
| 2012 | $2,976 +0.2% | $179,000 |
| 2011 | $2,968 -11% | $179,000 -16.7% |
| 2010 | $3,334 +1.5% | $215,000 -1.3% |
| 2009 | $3,285 -18.7% | $217,730 -26% |
| 2008 | $4,040 -19.9% | $294,192 -25.5% |
| 2007 | $5,044 +45% | $395,000 +59.9% |
| 2006 | $3,479 +280.8% | $247,000 +470% |
| 2005 | $914 | $43,335 |
Find assessor info on the county website
Monthly payment
Est. payment
Payment breakdown
Explore the cost of this home by adjusting the details. Changes won't be saved.Climate risks
Neighborhood: Fox Run
Nearby schools
Schools provided by the listing agent
- Elementary: Almondale
- Middle: Freedom
- High: Frontier
Source: Bakersfield AOR. This data may not be complete. We recommend contacting the local school district to confirm school assignments for this home.
- $495,9003 bd2 ba2.1k sqft11304 Sand Bridge Ct, Bakersfield, CA 93312Off Market
- $425,7003 bd2 ba1.7k sqft11305 Sand Bridge Ct, Bakersfield, CA 93312Off Market
- $410,7003 bd2 ba1.7k sqft11308 Sand Bridge Ct, Bakersfield, CA 93312Off Market

- $386,0003 bd2 ba1.2k sqft11309 Sand Bridge Ct, Bakersfield, CA 93312Off Market
Similar homes
- $400,0004 bd2 ba1.7k sqft11718 Cotner Ave, Bakersfield, CA 93312For Sale
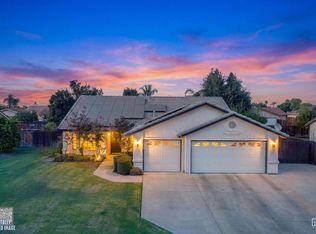 MLS ID #202612057, Adam G. Belter. Bakersfield AOR
- $--4 bd2 ba2.6k sqft5204 Challenger Ave, Bakersfield, CA 93312Auction
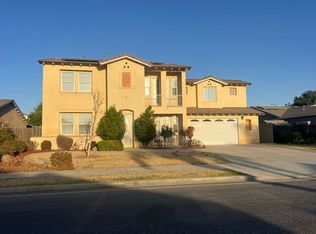 ServiceLink Auction
- $450,0004 bd3 ba2.3k sqft11418 Pacific Harbor Ave, Bakersfield, CA 93312For Sale
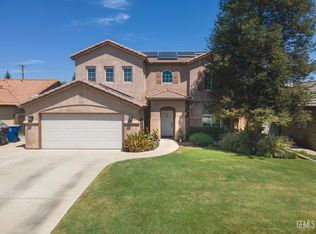 MLS ID #202609057, William Amir Gordon. Bakersfield AOR
- $399,9003 bd2 ba1.2k sqft10006 Thistledown Ln, Bakersfield, CA 93312For Sale
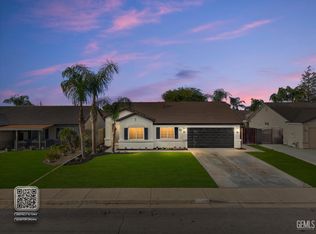 MLS ID #202612065, Alishaan Abbas. Bakersfield AOR
