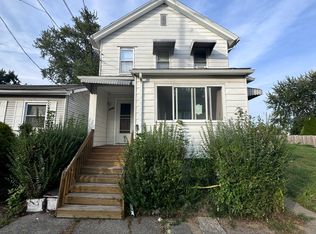
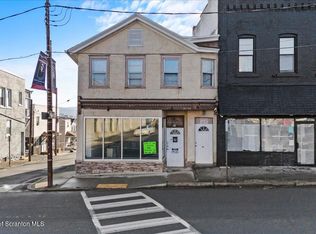
Vacant up/down 2-unit. Separate water and electric make it ideal for investors or owner-occupants. Natural gas heating. Both units are move-in ready and positioned for immediate rental income. Clean, straightforward opportunity with solid potential.
Pending
Price cut: $10K (5/1)
$250,000
1134 Hampton St, Scranton, PA 18504
6beds
2,246sqft
Multi Family
Built in 1940
-- sqft lot
$-- Zestimate®
$111/sqft
$-- HOA
What's special
Natural gas heating
- 77 days |
- 135 |
- 8 |
Zillow last checked:
Listing updated:
Listed by:
Alexsis McGhee,
EXP Realty LLC 888-397-7352
Source: GSBR as distributed by MLS GRID,MLS#: SC261427
Facts & features
Interior
Bedrooms & bathrooms
- Bedrooms: 6
- Bathrooms: 2
- Full bathrooms: 2
Heating
- Natural Gas, Steam
Features
- Basement: Unfinished
Interior area
- Total structure area: 2,246
- Total interior livable area: 2,246 sqft
- Finished area above ground: 2,246
- Finished area below ground: 0
Property
Features
- Stories: 2
Lot
- Size: 3,484 Square Feet
- Dimensions: 27 x 133
Details
- Parcel number: 15605070037
- Zoning: R1
Construction
Type & style
- Home type: MultiFamily
- Property subtype: Multi Family
Materials
- Roof: Flat,Shingle
Condition
- New construction: No
- Year built: 1940
Utilities & green energy
- Water: Public
- Utilities for property: Cable Available, Water Connected, Sewer Connected, Natural Gas Connected, Electricity Connected
Community & HOA
Location
- Region: Scranton
Financial & listing details
- Price per square foot: $111/sqft
- Tax assessed value: $8,500
- Annual tax amount: $2,656
- Date on market: 4/9/2026
- Cumulative days on market: 41 days
- Listing terms: Cash,VA Loan,FHA,Conventional
- Electric utility on property: Yes
Estimated market value
Not available
Estimated sales range
Not available
$1,950/mo
Price history
| Date | Event | Price |
|---|---|---|
| 6/1/2026 | Pending sale | $250,000$111/sqft |
Source: | ||
| 5/1/2026 | Price change | $250,000-3.8%$111/sqft |
Source: | ||
| 4/9/2026 | Listed for sale | $260,000+20.9%$116/sqft |
Source: | ||
| 9/6/2024 | Sold | $215,000+7.6%$96/sqft |
Source: | ||
| 7/22/2024 | Pending sale | $199,900$89/sqft |
Source: | ||
| 6/21/2024 | Listed for sale | $199,900$89/sqft |
Source: | ||
| 1/18/2024 | Listing removed | -- |
Source: | ||
| 1/6/2024 | Listed for sale | $199,900+73.8%$89/sqft |
Source: | ||
| 11/30/2023 | Sold | $115,000$51/sqft |
Source: | ||
| 11/17/2023 | Pending sale | $115,000$51/sqft |
Source: | ||
| 11/15/2023 | Listed for sale | $115,000$51/sqft |
Source: | ||
Public tax history
| Year | Property taxes | Tax assessment |
|---|---|---|
| 2025 | $2,656 +9.7% | $8,500 |
| 2024 | $2,422 | $8,500 |
| 2023 | $2,422 +200.1% | $8,500 |
| 2022 | $807 | $8,500 |
| 2021 | $807 -63.7% | $8,500 |
| 2020 | $2,223 +1.8% | $8,500 |
| 2018 | $2,183 +261.9% | $8,500 |
| 2017 | $603 | $8,500 |
| 2016 | -- | $8,500 |
| 2015 | -- | $8,500 |
| 2014 | $1,266 | $8,500 |
| 2013 | -- | $8,500 |
| 2012 | -- | $8,500 |
| 2011 | -- | $8,500 |
| 2010 | -- | $8,500 |
| 2009 | -- | $8,500 |
| 2008 | -- | $8,500 |
| 2007 | -- | $8,500 |
| 2006 | -- | $8,500 |
| 2005 | -- | $8,500 |
| 2004 | -- | $8,500 |
| 2003 | -- | $8,500 |
| 2002 | -- | $8,500 |
| 2000 | -- | $8,500 |
Find assessor info on the county website
Monthly payment
Est. payment$--/mo
Payment breakdown
Explore the cost of this home by adjusting the details. Changes won't be saved.All calculations are estimates and provided by Zillow, Inc. for informational purposes only. Actual amounts may vary.
HOA fees may include property taxes on listings classified as Co-Ops. Contact the listing agent and/or owner for fee details.
Mortgage interest rates are dependent on a number of factors, including credit score, down payment, and repayment length. Interest rate data provided by Zillow Group Marketplace, Inc. as of 1/1/1970 from various mortgage lenders with which we have lead or other similar arrangements; the Estimated Payment is an average of those rates.
See how much you could borrow to make a competitive offer.
Climate risks
Neighborhood: Hyde Park
Nearby schools
GreatSchools rating
- 4/10Frances Willard #32Grades: PK-4Distance: 0.1 mi
- 6/10West Scranton Intermediate SchoolGrades: 5-8Distance: 0.3 mi
- 4/10West Scranton High SchoolGrades: 9-12Distance: 0.2 mi
A local agent can set up tours, give advice and negotiate with sellers.
A local lender can help you make sure your offer is ready when you are.


- Pennsylvania
- Lackawanna County
- Scranton
- 18504
- Hyde Park
- 1134 Hampton St
Nearby cities
Nearby neighborhoods
Nearby zip codes
Other Scranton Topics
