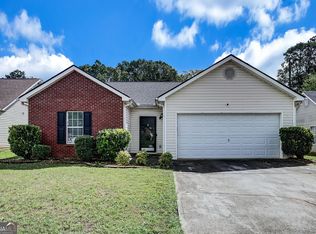
Jamine Park subdivision. Property Managed.
This property is off market, which means it's not currently listed for sale or rent on Zillow. This may be different from what's available on other websites or public sources.
$214,800
$198,000 - $228,000
$1,753/mo
$1,753/mo
Rent Zestimate®
Find your next renter with Zillow Rental Manager. Plus, with online applications, you can quickly screen prospective tenants – for free.
$1,753/mo
Rent Zestimate®
$1,426/mo
Est. payment
Refinancing to a lower rate could help reduce your monthly payments and save thousands over the life of the loan.
$1,426/mo
Est. payment
Work with a Zillow partner agent
Leverage their expertise and Zillow's premium Showcase listings to get your home seen by more buyers.
Get startedList with your own agent
Get your home in front of millions of buyers by listing it on Zillow.
Learn how to do itSell it yourself
Take full control of how buyers see your home on Zillow by listing For Sale by Owner (FSBO).
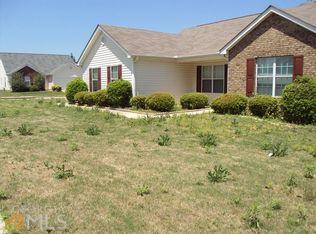
List your homeJamine Park subdivision. Property Managed.
This property is off market, which means it's not currently listed for sale or rent on Zillow. This may be different from what's available on other websites or public sources.
| Date | Event | Price |
|---|---|---|
| 1/6/2018 | Listing removed | $900$1/sqft |
Source: Vestlet Property Management Report a problem | ||
| 1/4/2018 | Listed for rent | $900$1/sqft |
Source: Vestlet Property Management Report a problem | ||
| 12/8/2016 | Listing removed | $900-5.3%$1/sqft |
Source: Vestlet Property Management Report a problem | ||
| 11/7/2016 | Sold | $87,000-8.4%$58/sqft |
Source: Public Record Report a problem | ||
| 8/22/2016 | Listed for sale | $95,000$63/sqft |
Source: The Jordon Wheeler Group, LLC #5711812 Report a problem | ||
| 8/2/2016 | Pending sale | $95,000$63/sqft |
Source: The Jordon Wheeler Group, LLC #5711812 Report a problem | ||
| 6/25/2016 | Price change | $95,000+5.6%$63/sqft |
Source: The Jordon Wheeler Group, LLC #5711812 Report a problem | ||
| 1/20/2016 | Pending sale | $90,000$60/sqft |
Source: The Jordon Wheeler Group, LLC #5302318 Report a problem | ||
| 1/20/2016 | Listed for sale | $90,000$60/sqft |
Source: The Jordon Wheeler Group, LLC #5302318 Report a problem | ||
| 7/22/2015 | Listing removed | $90,000$60/sqft |
Source: THE JORDON WHEELER GROUP #07283626 Report a problem | ||
| 5/30/2015 | Listed for sale | $90,000$60/sqft |
Source: THE JORDON WHEELER GROUP #07283626 Report a problem | ||
| 7/27/2014 | Listing removed | $90,000$60/sqft |
Source: THE JORDON WHEELER GROUP #07283626 Report a problem | ||
| 7/6/2014 | Listing removed | $950+15.2%$1/sqft |
Source: THE JORDON WHEELER GROUP #07283617 Report a problem | ||
| 7/1/2014 | Price change | $90,000-2.2%$60/sqft |
Source: THE JORDON WHEELER GROUP #07283626 Report a problem | ||
| 6/9/2014 | Listed for sale | $92,000+140.8%$61/sqft |
Source: THE JORDON WHEELER GROUP #07283626 Report a problem | ||
| 4/23/2014 | Price change | $825-2.9%$1/sqft |
Source: My Rent Source, LLC Report a problem | ||
| 3/8/2014 | Price change | $850-2.9%$1/sqft |
Source: My Rent Source, LLC Report a problem | ||
| 2/5/2014 | Listed for rent | $875+2.9%$1/sqft |
Source: My Rent Source, LLC Report a problem | ||
| 12/27/2012 | Listing removed | $850$1/sqft |
Source: My Rent Source, LLC Report a problem | ||
| 11/10/2012 | Listed for rent | $850$1/sqft |
Source: My Rent Source, LLC Report a problem | ||
| 4/27/2012 | Sold | $38,200-9.7%$25/sqft |
Source: Public Record Report a problem | ||
| 3/7/2012 | Price change | $42,300-10%$28/sqft |
Source: Steve Redding and Associates, LLC #03184724 Report a problem | ||
| 2/8/2012 | Listed for sale | $47,000$31/sqft |
Source: foreclosure.com Report a problem | ||
| Year | Property taxes | Tax assessment |
|---|---|---|
| 2025 | $3,968 +0.3% | $103,600 +2.2% |
| 2024 | $3,954 +23.3% | $101,360 +14.1% |
| 2023 | $3,206 +25.4% | $88,800 +36.3% |
| 2022 | $2,557 +8.3% | $65,160 +9% |
| 2021 | $2,362 +12.3% | $59,800 +13.7% |
| 2020 | $2,103 +11.7% | $52,576 -54.6% |
| 2019 | $1,882 +29.5% | $115,903 +223.7% |
| 2018 | $1,454 +4.4% | $35,804 +7.6% |
| 2017 | $1,392 | $33,268 |
| 2016 | $1,392 | $33,268 |
| 2015 | $1,392 +18.3% | -- |
| 2014 | $1,177 +51.8% | $26,950 |
| 2013 | $775 -38.1% | -- |
| 2012 | $1,251 -29.1% | -- |
| 2011 | $1,764 +4.7% | -- |
| 2010 | $1,685 -4.5% | -- |
| 2009 | $1,765 +3.7% | -- |
| 2008 | $1,703 +1.3% | -- |
| 2007 | $1,681 +0.5% | -- |
| 2006 | $1,672 +9.3% | -- |
| 2005 | $1,529 +5.1% | -- |
| 2003 | $1,455 | -- |
Find assessor info on the county website
Source: The MLS. This data may not be complete. We recommend contacting the local school district to confirm school assignments for this home.