Vacant lot. Attention builders, developers, and savvy investors! Incredible opportunity to acquire a prime residential parcel located in Chicago's growing West Pullman neighborhood (60643). Whether you are looking to build a custom single-family home to sell or expand your investment portfolio with new construction inventory, this site offers endless potential. Previous building on the land was a 3 unit building with 2900 square feet
Price change
Price cut: $500 (10/22)
$7,500
11805 S Peoria St, Chicago, IL 60643
--beds
--baths
3,125Square Feet
Unimproved Land
Built in ----
3,125 Square Feet Lot
$-- Zestimate®
$--/sqft
$-- HOA
What's special
Prime residential parcel
- 45 days
- 13
- 2
Zillow last checked:
Listing updated:
Listed by:
Russell Walker 773-968-3377,
Home First Realty Inc
Source: MRED as distributed by MLS GRID,MLS#: 12756266
Facts & features
Property
Features
- Frontage length: 25
Lot
- Size: 3,125 Square Feet
- Dimensions: 25X125
Details
- Parcel number: 25204220440000
- Special conditions: None
Utilities & green energy
- Utilities for property: Electric to Site
Community & HOA
Location
- Region: Chicago
Financial & listing details
- Tax assessed value: $30,150
- Annual tax amount: $627
- Date on market: 9/10/2026
- Ownership: Fee Simple
- Electric utility on property: Yes
- Road surface type: Asphalt
Estimated market value
Not available
Estimated sales range
Not available
Not available
Price history
| Date | Event | Price |
|---|---|---|
| 10/22/2026 | Price change | $7,500-6.3% |
Source:  MRED as distributed by MLS GRID #12756266 Report a problem | ||
| 10/9/2026 | Price change | $8,000-5.9% |
Source: MRED as distributed by MLS GRID #12756266 Report a problem | ||
| 10/1/2026 | Price change | $8,500-5.6% |
Source: MRED as distributed by MLS GRID #12756266 Report a problem | ||
| 9/23/2026 | Price change | $9,000-9.1% |
Source: MRED as distributed by MLS GRID #12756266 Report a problem | ||
| 9/10/2026 | Listed for sale | $9,900-81.7% |
Source: MRED as distributed by MLS GRID #12756266 Report a problem | ||
| 7/20/2016 | Sold | $54,000 |
Source: MRED as distributed by MLS GRID #09018784 Report a problem | ||
Public tax history
| Year | Property taxes | Tax assessment |
|---|---|---|
| 2024 | $607 +42.9% | $3,015 +50% |
| 2023 | $425 +2.5% | $2,010 |
| 2022 | $415 +2.3% | $2,010 |
| 2021 | $405 -34.3% | $2,010 -27.3% |
| 2020 | $617 -63.7% | $2,763 -67.3% |
| 2019 | $1,700 +1.7% | $8,437 |
| 2018 | $1,671 -52.5% | $8,437 -48.2% |
| 2017 | $3,517 +7.5% | $16,301 |
| 2016 | $3,273 +9.3% | $16,301 |
| 2015 | $2,994 +23.4% | $16,301 +24.9% |
| 2014 | $2,427 +2% | $13,047 |
| 2013 | $2,378 +1.4% | $13,047 |
| 2012 | $2,346 -12.1% | $13,047 -20.6% |
| 2011 | $2,670 -0.4% | $16,438 |
| 2010 | $2,680 +4.4% | $16,438 |
| 2009 | $2,568 +3.1% | $16,438 -5.2% |
| 2008 | $2,492 +1.1% | $17,339 |
| 2007 | $2,466 -1.1% | $17,339 |
| 2006 | $2,492 +29% | $17,339 +46.9% |
| 2005 | $1,933 +1% | $11,807 |
| 2004 | $1,913 +2.2% | $11,807 |
| 2003 | $1,872 +4.9% | $11,807 +19.1% |
| 2002 | $1,784 +3.7% | $9,916 |
| 2001 | $1,720 +12.7% | $9,916 |
| 2000 | $1,526 -0.7% | $9,916 +25% |
| 1999 | $1,536 | $7,932 |
Find assessor info on the county website
Monthly payment
Climate risks
Neighborhood: West Pullman
Nearby schools


Similar homes
- $10,0004,958 sqft11801 S Peoria St, Chicago, IL 60643Active
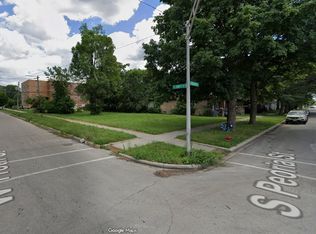 MLS ID #12742984, Jeanine Czerwin, Wirtz Real Estate Group Inc.. MRED as distributed by MLS GRID
- $10,0003,425 sqft11747 S Lowe Ave, Chicago, IL 60628Active
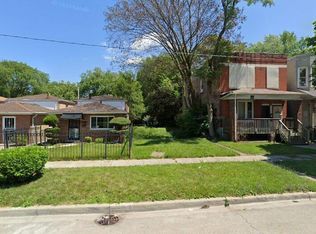 MLS ID #12741805, Jeanine Czerwin, Wirtz Real Estate Group Inc.. MRED as distributed by MLS GRID
- $10,0003,125 sqft1114 W 110th Pl, Chicago, IL 60643Active
 MLS ID #12732910, Jeanine Czerwin, Wirtz Real Estate Group Inc.. MRED as distributed by MLS GRID
- $10,0002,976 sqft1119 W 111th St, Chicago, IL 60643Active
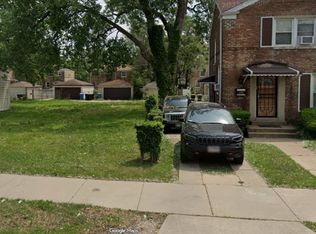 MLS ID #12732920, Jeanine Czerwin, Wirtz Real Estate Group Inc.. MRED as distributed by MLS GRID
