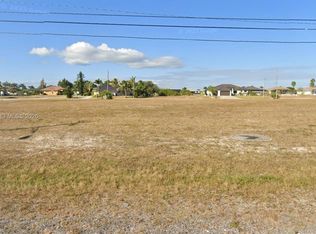
Beautiful NW Cape Coral property cleared and ready for your dream home to be built. This lot features W exposure and is minutes from schools, shopping, dining, and entertainment. This beautiful lot is in a great area surrounded by many well-designed new constructions. Build now or buy for an investment.
Active
Price cut: $14.1K (4/20)
$79,900
1202 Old Burnt Store Rd N, Cape Coral, FL 33993
--beds
--baths
10,497Square Feet
Unimproved Land
Built in ----
10,497 Square Feet Lot
$-- Zestimate®
$--/sqft
$-- HOA
What's special
- 747 days |
- 4 |
- 0 |
Zillow last checked:
Listing updated:
Listed by:
Jeily Munoz Alfonso,
Serhant
Source: Florida Gulf Coast MLS,MLS#: 224051750 Originating MLS: Florida Gulf Coast
Facts & features
Interior
Video & virtual tour
Property
Features
- Has view: Yes
- View description: City
- Waterfront features: None
Lot
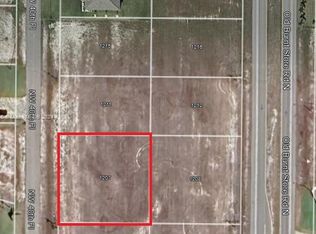
- Size: 10,497 Square Feet
- Dimensions: 80 x 125 x 80 x 125
- Features: Rectangular Lot
Details
- Parcel number: 014422C205228.0290
- Lease amount: $0
- Zoning description: R1-D
Utilities & green energy
- Sewer: Septic Tank
- Water: Well
- Utilities for property: Cable Available, Trash Collection, Water Available
Community & HOA
Community
- Features: Non-Gated
- Condo and coop fee: $0
- Membership fee: $0
- Subdivision: CAPE CORAL
HOA
- Amenities included: None
- Services included: None
Location
- Region: Cape Coral
Financial & listing details
- Tax assessed value: $52,488
- Annual tax amount: $1,122
- Date on market: 6/14/2024
- Cumulative days on market: 748 days
- Listing terms: Cash
- Road surface type: Paved
Estimated market value
Not available
Estimated sales range
Not available
$2,701/mo
Price history
| Date | Event | Price |
|---|---|---|
| 4/20/2026 | Price change | $79,900-15% |
Source: | ||
| 4/14/2025 | Price change | $94,000-1.1% |
Source: | ||
| 6/15/2024 | Listed for sale | $95,000 |
Source: | ||
| 2/5/2024 | Listing removed | -- |
Source: | ||
| 12/20/2023 | Price change | $95,000-9.5% |
Source: | ||
| 10/7/2023 | Price change | $105,000-4.5% |
Source: | ||
| 5/17/2023 | Listed for sale | $110,000+13.4% |
Source: | ||
| 5/16/2023 | Listing removed | -- |
Source: | ||
| 4/15/2023 | Listed for sale | $97,000-2.9% |
Source: | ||
| 1/17/2023 | Listing removed | -- |
Source: Owner Report a problem | ||
| 10/19/2022 | Listed for sale | $99,900+739.5% |
Source: Owner Report a problem | ||
| 11/20/2015 | Sold | $11,900 |
Source: Public Record Report a problem | ||
| 11/2/2015 | Pending sale | $11,900 |
Source: Land Brokers Inc #215029394 Report a problem | ||
| 5/26/2015 | Price change | $11,900+48.8% |
Source: Land Brokers Inc #215029394 Report a problem | ||
| 4/12/2015 | Pending sale | $8,000 |
Source: Miloff Aubuchon Realty Group, Inc #215016796 Report a problem | ||
| 3/12/2015 | Listed for sale | $8,000-46.7% |
Source: Miloff Aubuchon Realty Group I #215016796 Report a problem | ||
| 3/22/2002 | Sold | $15,000+200% |
Source: Public Record Report a problem | ||
| 3/21/2000 | Sold | $5,000+42.9% |
Source: Public Record Report a problem | ||
| 12/13/1999 | Sold | $3,500+288.9% |
Source: Public Record Report a problem | ||
| 4/14/1999 | Sold | $900 |
Source: Public Record Report a problem | ||
Public tax history
| Year | Property taxes | Tax assessment |
|---|---|---|
| 2025 | $1,073 +4.2% | $20,936 +10% |
| 2024 | $1,030 -8.3% | $19,033 +10% |
| 2023 | $1,122 +28.5% | $17,303 +10% |
| 2022 | $873 +43.3% | $15,730 +10% |
| 2021 | $609 +8.1% | $14,300 +10% |
| 2020 | $564 -1.9% | $13,000 -13.3% |
| 2019 | $575 | $15,000 |
| 2018 | $575 +2.5% | $15,000 +20.6% |
| 2017 | $561 +10.4% | $12,436 +13.1% |
| 2016 | $508 +8.9% | $11,000 -5.2% |
| 2015 | $466 +16.7% | $11,600 +25.9% |
| 2014 | $400 +22.7% | $9,212 +61.6% |
| 2013 | $326 +41.4% | $5,700 |
| 2012 | $230 -13.4% | $5,700 -24% |
| 2011 | $266 -15.2% | $7,500 -19.4% |
| 2010 | $314 -13.1% | $9,300 -22.5% |
| 2009 | $361 -12.1% | $12,000 -40% |
| 2008 | $411 -59.8% | $20,000 -63.6% |
| 2007 | $1,021 -45.2% | $55,000 -45% |
| 2006 | $1,863 +220.7% | $100,000 +292.2% |
| 2004 | $581 +73.5% | $25,500 +88.9% |
| 2003 | $335 +175.1% | $13,500 +244.4% |
| 2002 | $122 | $3,920 +46.8% |
| 2000 | -- | $2,670 |
Find assessor info on the county website
Monthly payment
Estimated monthly payment$1,822
All calculations are estimates and provided by Zillow, Inc. for informational purposes only. Actual amounts may vary.
HOA fees may include property taxes on listings classified as Co-Ops. Contact the listing agent and/or owner for fee details.
Mortgage interest rates are dependent on a number of factors, including credit score, down payment, and repayment length. Interest rate data provided by Zillow Group Marketplace, Inc. as of 1/1/1970 from various mortgage lenders with which we have lead or other similar arrangements; the Estimated Payment is an average of those rates.
See how much you could borrow to make a competitive offer.
Climate risks
Neighborhood: 33993
Nearby schools
GreatSchools rating
- 6/10Trafalgar Elementary SchoolGrades: PK-5Distance: 4.6 mi
- 4/10Mariner Middle SchoolGrades: 6-8Distance: 3.3 mi
- 3/10Mariner High SchoolGrades: 9-12Distance: 3.2 mi

A local agent can set up tours, give advice and negotiate with sellers.


- Florida
- Lee County
- Cape Coral
- 33993
- 1202 Old Burnt Store Rd N
Nearby cities
Nearby neighborhoods
Nearby zip codes
Other Cape Coral Topics
