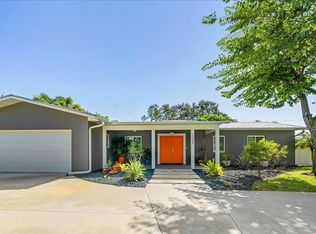
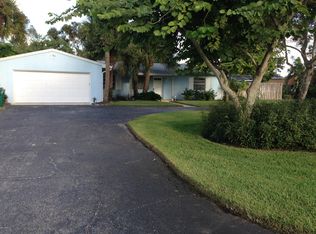
Large Indialantic SOFA Lot For Sale. Prime .44-Acre SOFA District Lot — Indialantic, FL — Utilities In, Ready to Build. House and pool are being removed!
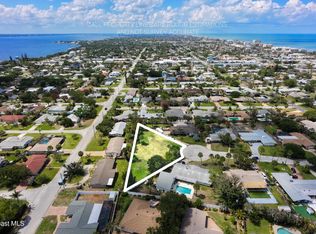
Rare opportunity to build your island dream home in the coveted SOFA District (South of Fifth Ave.) of Indialantic-by-the-Sea. This rectangular ~.44-acre lot (1½ lots) offers a generous building envelope with no wasted space.
Quiet street of custom-built homes, no HOA. Half a block to Orlando Park (playground, basketball, pickleball). One block to the river, four blocks to beach access. Walkable to restaurants and shops on 5th and Ocean Avenues, with quick access to the Melbourne Causeway.
Site prep already underway: house and pool being demolished, debris removed, and pool excavation being backfilled with compacted fill. Rough grading will leave the site level and ready for house pad prep or sod. Utilities and water already in place. Lot ready for your builder by late September/early October.
Buyer's agents welcome. No seller's agents, please.
Pending
$700,000
1209 Magnolia Dr, Indialantic, FL 32903
4beds
0baths
0.44Acres
VacantLand
Built in 1956
0.44 Acres Lot
$-- Zestimate®
$425/sqft
$290/mo HOA
Overview
- 43 days
- 85
- 0
Listed by:
Property Owner (321) 795-5468
Facts & features
Interior
Bedrooms & bathrooms
- Bedrooms: 4
- Bathrooms: 0
Interior area
- Total interior livable area: 1,648 sqft
Property
Parking
- Parking features: Garage - Attached
Features
- Exterior features: Cement / Concrete
Lot
- Size: 0.44 Acres
Details
- Parcel number: 283806ES749
Community & HOA
HOA
- Has HOA: Yes
- HOA fee: $290 monthly
Location
- Region: Indialantic
Financial & listing details
- Price per square foot: $425/sqft
- Tax assessed value: $629,370
- Annual tax amount: $2,781
- Date on market: 9/11/2026
Estimated market value
Not available
Estimated sales range
Not available
Not available
Price history
| Date | Event | Price |
|---|---|---|
| 9/18/2026 | Pending sale | $700,000$425/sqft |
Source: Owner Report a problem | ||
| 9/11/2026 | Listed for sale | $700,000+426.3%$425/sqft |
Source: Owner Report a problem | ||
| 12/27/1997 | Sold | $133,000+7.3%$81/sqft |
Source: Public Record Report a problem | ||
| 6/21/1995 | Sold | $124,000$75/sqft |
Source: Public Record Report a problem | ||
Public tax history
| Year | Property taxes | Tax assessment |
|---|---|---|
| 2025 | $2,781 +4.7% | $629,370 +231.5% |
| 2024 | $2,657 +2.9% | $189,830 +3% |
| 2023 | $2,583 +8.4% | $184,310 +3% |
| 2022 | $2,381 -2.3% | $178,950 +3% |
| 2021 | $2,438 +0.3% | $173,740 +1.4% |
| 2020 | $2,431 +1.6% | $171,350 +2.3% |
| 2019 | $2,392 | $167,500 +1.9% |
| 2018 | $2,392 -0.3% | $164,380 +2.1% |
| 2017 | $2,399 +3.8% | $161,000 -19.2% |
| 2016 | $2,312 -0.6% | $199,270 +6.7% |
| 2015 | $2,325 -3% | $186,810 +20.2% |
| 2014 | $2,398 | $155,360 -31.2% |
| 2013 | -- | $225,680 +8.8% |
| 2012 | $2,397 +3.9% | $207,410 -1.4% |
| 2011 | $2,307 +10.9% | $210,420 -14.7% |
| 2010 | $2,081 +9.7% | $246,570 -10.9% |
| 2009 | $1,896 +2.3% | $276,780 -15.9% |
| 2008 | $1,855 -5.3% | $329,000 -13% |
| 2007 | $1,959 +1% | $378,000 +26.4% |
| 2005 | $1,939 -2.4% | $299,070 +27.7% |
| 2004 | $1,987 -1.8% | $234,120 +29.6% |
| 2003 | $2,023 +3.1% | $180,690 +10.8% |
| 2002 | $1,963 +3.6% | $163,070 +11% |
| 2001 | $1,895 +6.2% | $146,960 +19.9% |
| 2000 | $1,784 | $122,570 |
Find assessor info on the county website
Monthly payment
Est. payment
Payment breakdown
Explore the cost of this home by adjusting the details. Changes won't be saved.Climate risks
Neighborhood: 32903
Similar homes
- $625,0000.47 acres320 Palm Ct, Indialantic, FL 32903Lot/Land
 MLS ID #1077402, C Anne Humphreys. Space Coast AOR
- $499,90010,018 sqft565 Newport Dr, Indialantic, FL 32903Lot/Land
 MLS ID #1085913, Barbara C Wall. Space Coast AOR
- $488,0000.28 acres760 Nightingale Dr, Indialantic, FL 32903Lot/Land
 MLS ID #1083796, Mark E Fontaine. Space Coast AOR
- $350,00012.48 acresNone Iss, Melbourne, FL 32901Lot/Land
 MLS ID #296897, Joseph P Schlitt, Douglas Elliman Florida LLC. Realtor Association of Indian River County
- $674,9001.07 acres1790 U.s. 1, Malabar, FL 32950Lot/Land
 MLS ID #B26062011, Debi A Jensen, Century 21 All Professional. BeachesMLS
