Skip main navigation
Off market
  • Tax assessed value
    $161,500

    1223 Old Burnt Store Rd N, Cape Coral, FL 33993

    --beds
    0baths
    10,018Square Feet
    VacantLand
    Built in ----
    10,018 Square Feet Lot
    $-- Zestimate®
    $--/sqft
    $2,709 Estimated rent

    Home value

    Not available

    Estimated sales range

    Not available

    $2,709/mo

    Zestimate® history
    Loading
    Loading...

    Owner options

    List your home for rent

    $2,709/mo

    Rent Zestimate®

    Find your next renter with Zillow Rental Manager. Plus, with online applications, you can quickly screen prospective tenants – for free.

    Learn more

    $2,709/mo

    Rent Zestimate®

    Refinance and save

    $1,100/mo

    Est. payment

    Refinancing to a lower rate could help reduce your monthly payments and save thousands over the life of the loan.

    See today's rates

    $1,100/mo

    Est. payment

    Explore your selling options

    Work with a Zillow partner agent

    Leverage their expertise and Zillow's premium Showcase listings to get your home seen by more buyers.

    Get started

    List with your own agent

    Get your home in front of millions of buyers by listing it on Zillow.

    Learn how to do it

    Sell it yourself

    Take full control of how buyers see your home on Zillow by listing For Sale by Owner (FSBO).

    List your home

    What's special

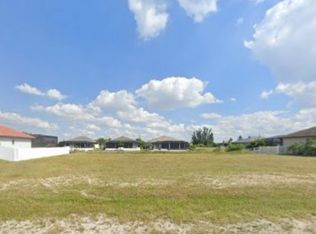
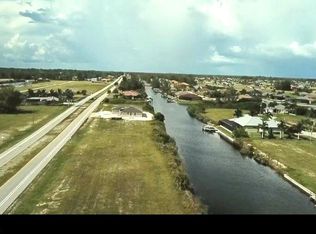
    Beautiful Gulf access lot in fast growing NW Cape Coral, with a brand new Concrete seawall and Concrete dock. Land is cleared and ready to build you new home!! Hurry with your offer before it is gone.

    This property is off market, which means it's not currently listed for sale or rent on Zillow. This may be different from what's available on other websites or public sources.

    Facts & features

    Interior

    Bedrooms & bathrooms
    • Bathrooms: 0

    Property

    Lot
    • Size: 10,018 sqft
    Details
    • Parcel number: 064423C1042560190

    Community & neighborhood

    Location
    • Region: Cape Coral

    Price history

    DateEventPrice
    7/1/2026Listing removed$189,900
    Source: Florida Gulf Coast MLS #2025011003 Report a problem
    4/1/2026Price change$189,900-5%
    Source: Florida Gulf Coast MLS #2025011003 Report a problem
    3/22/2026Price change$199,900-20%
    Source: Florida Gulf Coast MLS #2025011003 Report a problem
    9/17/2025Listed for sale$249,900-2%
    Source: Florida Gulf Coast MLS #2025011003 Report a problem
    7/16/2025Listing removed$255,000
    Source: SWFLMLS #225013346 Report a problem
    2/4/2025Listed for sale$255,000-12.1%
    Source: SWFLMLS #225013346 Report a problem
    2/5/2024Listing removed--
    Source: Florida Gulf Coast MLS #221004666 Report a problem
    10/23/2023Price change$290,000-3%
    Source: Florida Gulf Coast MLS #223056261 Report a problem
    9/19/2023Price change$299,000-3.2%
    Source: Florida Gulf Coast MLS #223056261 Report a problem
    8/3/2023Listed for sale$309,000+54.5%
    Source: Florida Gulf Coast MLS #223056261 Report a problem
    7/8/2022Sold$200,000-8.7%
    Source: Florida Gulf Coast MLS #222042704 Report a problem
    6/7/2022Pending sale$219,000
    Source: Florida Gulf Coast MLS #222042704 Report a problem
    6/3/2022Listed for sale$219,000+236.9%
    Source: Florida Gulf Coast MLS #222042704 Report a problem
    3/16/2021Sold$65,000
    Source: Florida Gulf Coast MLS #221004666 Report a problem
    1/21/2021Pending sale$65,000
    Source: Florida Gulf Coast MLS #221004666 Report a problem
    1/21/2021Listed for sale$65,000+622.2%
    Source: Florida Gulf Coast MLS #221004666 Report a problem
    4/1/2002Sold$9,000
    Source: Public Record Report a problem

    Public tax history

    YearProperty taxesTax assessment
    2025$3,063 +0.7%$161,500 -1.8%
    2024$3,043 -14%$164,501 -16%
    2023$3,540 +73%$195,824 +105.8%
    2022$2,046 +54.9%$95,144 +69.9%
    2021$1,321 +4.9%$56,000 +8.9%
    2020$1,260 +4.9%$51,446 -6.5%
    2019$1,201 $55,000
    2018$1,201 +2.8%$55,000
    2017$1,168 +4.7%$55,000
    2016$1,116 +4.6%$55,000 +5.8%
    2015$1,067 +6.1%$52,000 +30%
    2014$1,006 +17.8%$40,000 +40.8%
    2013$854 +39.8%$28,400 +18.3%
    2012$611 -24.2%$24,000 -27.3%
    2011$806 -21%$33,000 -21.4%
    2010$1,021 +2.9%$42,000
    2009$992 -31.1%$42,000 -47.5%
    2008$1,440 -47.7%$80,000 -48.4%
    2007$2,755 -40.2%$155,000 -38.7%
    2006$4,609 +154.2%$253,000 +200.7%
    2004$1,813 +30.4%$84,150 +37.5%
    2003$1,391 +201.6%$61,200 +225.2%
    2002$461 $18,820 +107%
    2000-- $9,090

    Find assessor info on the county website

    Neighborhood: 33993

    Nearby schools

    GreatSchools rating