Gulf access residential lot on 100-foot wide canal. Quiet street with only local residential traffic. Convenient to awesome restaurants, shopping & entertainment locations. Easy boat ride to Red Fish Cove. Then either up the river for some beautiful cruising, or out to the Gulf and Ft. Myers Beach or Sanibel. Opportunities abound for waterfront dining. Then of course there's great Gulf fishing for Grouper, or head up the inland waterway for some of the best shallow water fisheries in Florida: Redfish, Sea Trout, and SNOOK! Build your dream house and live the Florida Lifestyle!
Active
$199,999
123 SW 35th Ter, Cape Coral, FL 33914
--beds
--baths
10,018Square Feet
Unimproved Land
Built in ----
10,018 Square Feet Lot
$-- Zestimate®
$--/sqft
$-- HOA
What's special
Gulf access residential lot
- 324 days
- 29
- 4
Zillow last checked:
Listing updated:
Listed by:
Chazz Lavely 239-424-9224,
Dalton Wade Inc
Source: Florida Gulf Coast MLS,MLS#: 2025025545 Originating MLS: Florida Gulf Coast
Facts & features
Property
Features
- Has view: Yes
- View description: Water
- Has water view: Yes
- Water view: Water
- Waterfront features: Canal Access, Navigable Water
Lot
- Size: 10,018 Square Feet
- Dimensions: 80 x 125 x 80 x 125
- Features: Rectangular Lot
Details
- Parcel number: 024523C201813.0130
- Lease amount: $0
- Zoning description: R1-W
Utilities & green energy
- Sewer: Assessment Paid, Public Sewer
- Water: Assessment Paid, Public
- Utilities for property: Electricity Available, Sewer Available, Water Available
Community & HOA
Community
- Features: Boat Facilities
- Condo and coop fee: $0
- Membership fee: $0
- Subdivision: CAPE CORAL
HOA
- Services included: None
Location
- Region: Cape Coral
Financial & listing details
- Tax assessed value: $145,350
- Annual tax amount: $2,956
- Date on market: 12/20/2025
- Cumulative days on market: 325 days
- Listing terms: All Financing Considered,Cash
- Electric utility on property: Yes
- Road surface type: Paved
Estimated market value
Not available
Estimated sales range
Not available
Not available
Price history
| Date | Event | Price |
|---|---|---|
| 12/21/2025 | Listed for sale | $199,999+18% |
Source:  Florida Gulf Coast MLS #2025025545 Report a problem | ||
| 6/15/2022 | Sold | $169,453 |
Source: Florida Gulf Coast MLS #221041909 Report a problem | ||
| 5/18/2022 | Pending sale | $169,453 |
Source:  Florida Gulf Coast MLS #221041909 Report a problem | ||
| 3/10/2022 | Price change | $169,453-4.8% |
Source: Florida Gulf Coast MLS #221041909 Report a problem | ||
| 10/1/2021 | Listed for sale | $178,000+3.5% |
Source: Florida Gulf Coast MLS #221041909 Report a problem | ||
| 8/9/2021 | Listing removed | -- |
Source: Florida Gulf Coast MLS #221041909 Report a problem | ||
| 6/5/2021 | Listed for sale | $172,000-7% |
Source: Florida Gulf Coast MLS #221041909 Report a problem | ||
| 10/18/2004 | Sold | $185,000 |
Source: Public Record Report a problem | ||
Public tax history
| Year | Property taxes | Tax assessment |
|---|---|---|
| 2025 | $2,866 -3% | $145,350 -5.2% |
| 2024 | $2,956 -1.7% | $153,304 -3.9% |
| 2023 | $3,008 +93.2% | $159,506 +133.9% |
| 2022 | $1,557 +6.1% | $68,200 +10% |
| 2021 | $1,467 -11.4% | $62,000 -13.9% |
| 2020 | $1,655 +0.8% | $72,000 -15.7% |
| 2019 | $1,642 | $85,400 +4.9% |
| 2018 | $1,642 +4.4% | $81,400 +1.8% |
| 2017 | $1,573 +4.8% | $80,000 |
| 2016 | $1,500 +4.3% | $80,000 +0.3% |
| 2015 | $1,439 +3.3% | $79,800 +15.7% |
| 2014 | $1,393 +11.7% | $69,000 +83.5% |
| 2013 | $1,247 +42.7% | $37,600 +4.7% |
| 2012 | $874 -2.3% | $35,900 -3% |
| 2011 | $894 -9.7% | $37,000 -7.5% |
| 2010 | $990 -33.6% | $40,000 -38.5% |
| 2009 | $1,490 -2.3% | $65,000 -23.5% |
| 2008 | $1,526 -64.5% | $85,000 -65.1% |
| 2007 | $4,293 -3.3% | $243,670 |
| 2006 | $4,441 +103% | $243,670 +138.9% |
| 2004 | $2,188 +75.2% | $102,000 +86.1% |
| 2003 | $1,249 +166.8% | $54,800 +186.5% |
| 2002 | $468 | $19,130 +40.2% |
| 2000 | -- | $13,640 |
Find assessor info on the county website
Monthly payment
Climate risks
Neighborhood: 33914


Similar homes
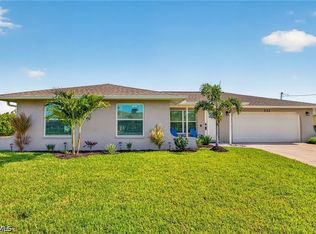
- $195,00010,018 sqft128 SW 34th LN, CAPE CORAL, FL 33914Lot/Land

 MLS ID #226038229, Lisandra Figueroa Batista, Key & Legacy Realty LLC. SWFLMLS
- $235,00010,018 sqft3535 SW 2nd AVE, CAPE CORAL, FL 33914Lot/Land
 MLS ID #226028922, Adam Bowman, Key Real Estate. SWFLMLS
- $119,0000.27 acres118 SW 31st Terrace Cpe, Coral, FL 33914Lot/Land
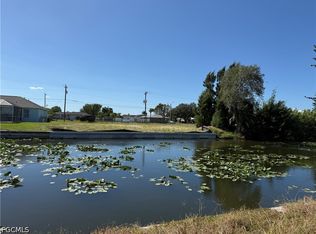
 MLS ID #2026043499, Mary Socin-Schmitz, Distinctive Realty and Homes, LLC. Florida Gulf Coast MLS
- $200,00010,018 sqft4132 Santa Barbara Blvd, Cape Coral, FL 33914Lot/Land
 MLS ID #224062117, Marceleen Wurst, Royal Shell Real Estate, Inc.. Florida Gulf Coast MLS
- $239,5000.29 acres201 SW 40th St, Cape Coral, FL 33914Lot/LandMLS ID #2026037547, Steve Giles, Starlink Realty, Inc. Florida Gulf Coast MLS
- $275,00010,018 sqft4208 SW 5th Ave, Cape Coral, FL 33914Lot/LandMLS ID #2026043266, Heiko Strauss, Century 21 AllPoints Realty. Florida Gulf Coast MLS
- $200,0000.32 acres4015 Chiquita BLVD S, CAPE CORAL, FL 33914Lot/LandMLS ID #226001317, Sebastian Bokemeier, Compass Florida LLC. SWFLMLS
- $129,90010,018 sqft3748 SW 11th Pl, Cape Coral, FL 33914Lot/LandMLS ID #2026043773, Jose Mazzei, Starlink Realty, Inc. Florida Gulf Coast MLS
- $265,00010,018 sqft107 SE 35th Ter, Cape Coral, FL 33904Lot/LandMLS ID #2026001420, Nic Grigsby, RE/MAX Realty Team. Florida Gulf Coast MLS
- $199,99910,018 sqft2615 SW 21st Ave, Cape Coral, FL 33914Lot/LandMLS ID #2026019170, Samina Qureshy, 3R Construction Group LLC. Florida Gulf Coast MLS
- $115,0000.34 acres3725 SW 7TH PLACE LOT 15-17, CAPE CORAL, FL 33914Lot/Land
 MLS ID #C7531821, Jehad Bader, MAMBA REALTY LLC. Stellar MLS
- $110,00010,628 sqft3206 SW 11th Place Cpe, Coral, FL 33914Lot/LandMLS ID #2026044900, Kelby Rendeiro, Caretta Blue LLC. Florida Gulf Coast MLS
- $159,0006.96 acres4000 SURFSIDE BLVD LOT A00, CAPE CORAL, FL 33914Lot/LandMLS ID #N6146053, Joanna Belka, EXIT KING REALTY. Stellar MLS
- $120,0000.34 acres1103 MOHAWK PARKWAY LOT 40, CAPE CORAL, FL 33914Lot/LandMLS ID #O6439646, Ari Banegas, EMPORIO REAL ESTATE. Stellar MLS
- $254,90010,018 sqft3429 SW 17th Place Cpe, Coral, FL 33914Lot/LandMLS ID #2026028600, Carolyn Giandonato, Charles Rutenberg Realty Inc. Florida Gulf Coast MLS
- $131,00010,001 sqftCape Coral, Cape Coral, FL 33914Lot/Land
 MLS ID #A11861388, Javier Santana, Sunland Real Estate, LLC.. MIAMI
- $280,00010,018 sqft427 SW 40th TER, CAPE CORAL, FL 33914Lot/LandMLS ID #226024229, Nikki Dimitrova, Florida Prime Realty, LLC. SWFLMLS
- $205,00010,802 sqft315 SE 29th Ter, Cape Coral, FL 33904Lot/LandMLS ID #2026040454, Steve Gant, Riverside Realty Services LLC. Florida Gulf Coast MLS
- $154,90010,018 sqft3009 SW 11th Pl, Cape Coral, FL 33914Lot/LandMLS ID #2026027144, Leo Gomez, Ace Realty & Associates, LLC. Florida Gulf Coast MLS
