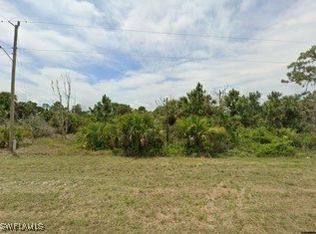
Great opportunity to build your dream home or invest in Lehigh Acres! This approximately 0.23-acre vacant residential lot offers space to create your ideal Florida home. Located in an established neighborhood with convenient access to shopping, dining, schools, and major roadways. No HOA. Buyer to verify zoning, building requirements, lot dimensions, and utility availability with the appropriate authorities.
Active
$26,000
1245 Cellini St E, Lehigh Acres, FL 33974
--beds
--baths
10,001Square Feet
Unimproved Land
Built in ----
10,001 Square Feet Lot
$-- Zestimate®
$--/sqft
$-- HOA
What's special
- 7 days
- 13
- 0
Zillow last checked:
Listing updated:
Listed by:
Samir Naim 818-268-9917,
Naim Real Estate LLC
Source: Florida Gulf Coast MLS,MLS#: 2026043755 Originating MLS: Florida Gulf Coast
Facts & features
Property
Features
- Waterfront features: None
Lot
- Size: 10,001 Square Feet
- Dimensions: 100 x 100 x 100 x 100
- Features: Rectangular Lot, Acreage
Details
- Parcel number: 244527L309082.0160
- Lease amount: $0
- Zoning description: RS-1
Utilities & green energy
- Sewer: None
- Water: Well
- Utilities for property: None, Sewer Not Available
Community & HOA
Community
- Features: Non-Gated
- Condo and coop fee: $0
- Membership fee: $0
- Subdivision: LEHIGH ACRES
HOA
- Services included: None
Location
- Region: Lehigh Acres
Financial & listing details
- Tax assessed value: $15,343
- Annual tax amount: $403
- Date on market: 10/16/2026
- Listing terms: Cash
- Road surface type: Paved
Estimated market value
Not available
Estimated sales range
Not available
Not available
Price history
| Date | Event | Price |
|---|---|---|
| 10/16/2026 | Listed for sale | $26,000+7.2% |
Source:  Florida Gulf Coast MLS #2026043755 Report a problem | ||
| 6/10/2026 | Listing removed | $24,250 |
Source: My State MLS #11655979 Report a problem | ||
| 4/16/2026 | Price change | $24,250-3% |
Source: My State MLS #11655979 Report a problem | ||
| 2/17/2026 | Listed for sale | $25,000+398.2% |
Source: My State MLS #11655979 Report a problem | ||
| 4/8/2021 | Sold | $5,018+47.6% |
Source: Public Record Report a problem | ||
| 12/4/2012 | Sold | $3,400+11.5% |
Source: Public Record Report a problem | ||
| 4/8/2010 | Sold | $3,050+34.5% |
Source: Public Record Report a problem | ||
| 3/13/2009 | Sold | $2,268 |
Source: Public Record Report a problem | ||
Public tax history
| Year | Property taxes | Tax assessment |
|---|---|---|
| 2025 | $403 +11.8% | $9,152 +10% |
| 2024 | $361 +8.3% | $8,320 +10% |
| 2023 | $333 +12.6% | $7,564 +10% |
| 2022 | $296 +15% | $6,876 +66.7% |
| 2021 | $257 +1.6% | $4,125 +10% |
| 2020 | $254 +132.3% | $3,750 +1.4% |
| 2019 | $109 | $3,700 |
| 2018 | $109 +10.2% | $3,700 +23.8% |
| 2017 | $99 +9.8% | $2,988 -25.3% |
| 2016 | $90 -2.5% | $4,000 +37.9% |
| 2015 | $93 +11% | $2,900 +12.2% |
| 2014 | $83 +25.6% | $2,585 +23.1% |
| 2013 | $66 +5.4% | $2,100 -7.1% |
| 2012 | $63 -19.5% | $2,260 -27.1% |
| 2011 | $78 -1.2% | $3,100 |
| 2010 | $79 -13.9% | $3,100 -22.5% |
| 2009 | $92 -32.6% | $4,000 -45.2% |
| 2008 | $137 -56.9% | $7,300 -60.5% |
| 2007 | $317 -54.1% | $18,500 -54.9% |
| 2006 | $689 +978.4% | $41,000 +1608.3% |
| 2004 | $64 +40.6% | $2,400 +71.4% |
| 2003 | $45 +7.9% | $1,400 +16.7% |
| 2002 | $42 | $1,200 +33.3% |
| 2000 | -- | $900 |
Find assessor info on the county website
Monthly payment
Climate risks
Neighborhood: 33974
Similar homes
- $16,50011,000 acresLee County Unincorporated, Lehigh Acres, FL 33974Lot/Land
 MLS ID #A12102059, David Gonzalez, Florida Realty of Miami Corp. MIAMI
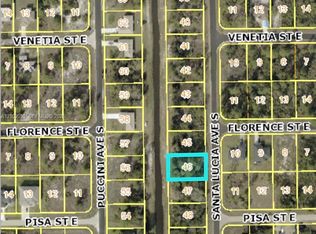
- $20,00010,001 sqft771 Columbus Blvd, Lehigh Acres, FL 33974Lot/Land
 MLS ID #2026042026, Pam O'Hara, Sellstate 5 Star Realty. Florida Gulf Coast MLS
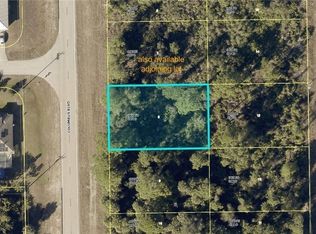
- $20,00010,001 sqft769 Columbus Blvd, Lehigh Acres, FL 33974Lot/Land
 MLS ID #2026042192, Pam O'Hara, Sellstate 5 Star Realty. Florida Gulf Coast MLS
- $33,0000.25 acres1208 Fogia St E, Lehigh Acres, FL 33974For Sale By Owner

- $26,0000.3 acres1233 Gennaio St E, Lehigh Acres, FL 33974Lot/LandMLS ID #2026034813, Jenny Guillen, EXP Realty LLC. Florida Gulf Coast MLS
- $27,70010,001 sqft1234 GARIBALDI STREET E LOT 2, LEHIGH ACRES, FL 33974Lot/Land
 MLS ID #TB8539703, Emanuel Goldszmidt, PROFESSIONAL REALTY SERVICES LLC. Stellar MLS
- $25,0000.26 acres771 Milano Ave S, Lehigh Acres, FL 33974Lot/LandMLS ID #2026031577, Jordan Smith, Precision Realty Group. Florida Gulf Coast MLS
- $28,00010,001 sqft1140 Jaguar Blvd, Lehigh Acres, FL 33974Lot/LandMLS ID #2026036942, RealMichServices Brown, Sellstate 5 Star Realty. Florida Gulf Coast MLS
- $24,90010,001 sqft1109 Garibaldi St E, Lehigh Acres, FL 33974Lot/LandMLS ID #2026041388, Julio Lapon, Lapon Realty. Florida Gulf Coast MLS
- $24,90010,001 sqft1107 Garibaldi St E, Lehigh Acres, FL 33974Lot/LandMLS ID #2026041384, Julio Lapon, Lapon Realty. Florida Gulf Coast MLS
- $19,90010,044 sqft745 Aprile Ave S, Lehigh Acres, FL 33974Lot/LandMLS ID #2026041294, Nohemy Garcia, MGR Realty Services, Inc.. Florida Gulf Coast MLS
- $16,10010,001 sqft747 Milano Ave S, Lehigh Acres, FL 33974Lot/LandMLS ID #2026042040, Bruno Franco, RE/MAX Realty Team. Florida Gulf Coast MLS
- $24,90010,001 sqft1226 Cellini St E, Lehigh Acres, FL 33974Lot/LandMLS ID #2026015663, Irelis Garcia Lopez, First Step Realty Group. Florida Gulf Coast MLS
- $38,9000.3 acres1232 GARIBALDI STREET E LOT 1, LEHIGH ACRES, FL 33974Lot/LandMLS ID #TB8539698, Emanuel Goldszmidt, PROFESSIONAL REALTY SERVICES LLC. Stellar MLS
- $20,0000.26 acres1212 Earnest ST E, LEHIGH ACRES, FL 33974Lot/Land
 MLS ID #226037462, Danielle Stefanacci, Corkscrew Real Estate. SWFLMLS
- $20,0000.29 acres927 Marilyn AVE S, LEHIGH ACRES, FL 33974Lot/LandMLS ID #226037465, Danielle Stefanacci, Corkscrew Real Estate. SWFLMLS
- $28,9000.34 acres771 Aprile Ave S, Lehigh Acres, FL 33974Lot/LandMLS ID #2026027350, Ayalibys Liriano De Perez, First Step Realty Group. Florida Gulf Coast MLS
- $19,90010,001 sqft1239 Cellini St E, Lehigh Acres, FL 33974Lot/LandMLS ID #2026028548, Matt Jackson, Realty World-C Bagans 1st. Florida Gulf Coast MLS
