This 1143 square foot single family home has 2 bedrooms and 2.0 bathrooms. This home is located at 126 S Perry St, Denver, CO 80219.
Pre-foreclosure
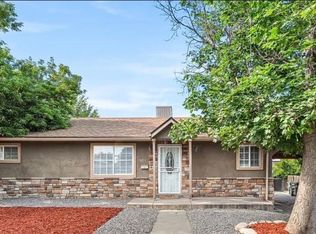
Street View
Est. $455,200
126 S Perry St, Denver, CO 80219
2beds
2baths
1,143sqft
SingleFamily
Built in 1955
6,240 Square Feet Lot
$455,200 Zestimate®
$398/sqft
$-- HOA
Overview
- 50 days |
- 20 |
- 0 |
Facts & features
Interior
Bedrooms & bathrooms
- Bedrooms: 2
- Bathrooms: 2
Heating
- Forced air
Features
- Basement: Finished
Interior area
- Total interior livable area: 1,143 sqft
Property
Parking
- Parking features: Garage - Attached
Features
- Exterior features: Brick
Lot
- Size: 6,240 Square Feet
Details
- Parcel number: 0507420003000
Construction
Type & style
- Home type: SingleFamily
Condition
- Year built: 1955
Community & HOA
Location
- Region: Denver
Financial & listing details
- Price per square foot: $398/sqft
- Tax assessed value: $542,300
- Annual tax amount: $2,530
Visit our professional directory to find a foreclosure specialist in your area that can help with your home search.
Find a foreclosure agentForeclosure details
Estimated market value
$455,200
$423,000 - $487,000
$2,533/mo
Price history
| Date | Event | Price |
|---|---|---|
| 9/3/2019 | Sold | $300,000+150%$262/sqft |
Source: Public Record Report a problem | ||
| 1/11/1999 | Sold | $120,000+71.7%$105/sqft |
Source: Public Record Report a problem | ||
| 12/15/1993 | Sold | $69,900$61/sqft |
Source: Public Record Report a problem | ||
Public tax history
| Year | Property taxes | Tax assessment |
|---|---|---|
| 2024 | $2,530 +20.2% | $32,650 -8.5% |
| 2023 | $2,104 +3.6% | $35,670 +34.8% |
| 2022 | $2,031 +10.7% | $26,460 -2.8% |
| 2021 | $1,835 +2.9% | $27,220 +10.1% |
| 2020 | $1,783 +23.1% | $24,732 -0.7% |
| 2019 | $1,448 | $24,905 +33% |
| 2018 | $1,448 +0.3% | $18,720 |
| 2017 | $1,444 +45.4% | $18,720 +28% |
| 2016 | $993 +37% | $14,630 +15.1% |
| 2015 | $725 0% | $12,710 +45.6% |
| 2014 | $725 -22.1% | $8,730 |
| 2013 | $931 +17.9% | $8,730 -21.1% |
| 2012 | $789 -13.2% | $11,070 +0% |
| 2011 | $910 +2.2% | $11,068 -19% |
| 2010 | $890 -6.7% | $13,660 |
| 2009 | $954 -0.2% | $13,660 -4.3% |
| 2008 | $955 -4% | $14,280 |
| 2007 | $996 +1.1% | $14,280 -4% |
| 2006 | $984 +0.6% | $14,870 |
| 2005 | $978 +17.8% | $14,870 -4.7% |
| 2003 | $831 +1.9% | $15,610 +12.5% |
| 2002 | $815 | $13,880 +33.6% |
| 2001 | -- | $10,390 |
Find assessor info on the county website
Monthly payment
Estimated monthly payment$1,822
All calculations are estimates and provided by Zillow, Inc. for informational purposes only. Actual amounts may vary.
HOA fees may include property taxes on listings classified as Co-Ops. Contact the listing agent and/or owner for fee details.
Mortgage interest rates are dependent on a number of factors, including credit score, down payment, and repayment length. Interest rate data provided by Zillow Group Marketplace, Inc. as of 1/1/1970 from various mortgage lenders with which we have lead or other similar arrangements; the Estimated Payment is an average of those rates.
See how much you could borrow to make a competitive offer.
Climate risks
Neighborhood: Barnum
Nearby schools
GreatSchools rating
- 4/10Knapp Elementary SchoolGrades: PK-5Distance: 0.5 mi
- 4/10Kepner Beacon Middle SchoolGrades: 6-8Distance: 1.2 mi
- 3/10West High SchoolGrades: 9-12Distance: 2.7 mi


- Colorado
- Denver County
- Denver
- 80219
- Barnum
- 126 S Perry St
Nearby cities
Nearby neighborhoods
Nearby zip codes
Other Denver Topics
