This 1109 square foot single family home has 3 bedrooms and 1.0 bathrooms. This home is located at 1260 NW 68th St, Miami, FL 33147.
Pre-foreclosure
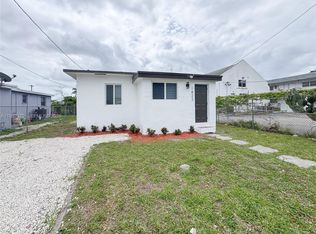
Street View
Est. $413,300
1260 NW 68th St, Miami, FL 33147
3beds
1,109sqft
SingleFamily
Built in 1950
5,401 Square Feet Lot
$413,300 Zestimate®
$373/sqft
$-- HOA
Overview
- 290 days |
- 6 |
- 1 |
Facts & features
Interior
Bedrooms & bathrooms
- Bedrooms: 3
- Bathrooms: 1
- Full bathrooms: 1
Heating
- Forced air
Cooling
- Central
Appliances
- Included: Range / Oven, Refrigerator
Features
- First Floor Entry
- Flooring: Carpet
Interior area
- Total interior livable area: 1,109 sqft
Property
Features
- Exterior features: Other
Lot
- Size: 5,401 Square Feet
Details
- Parcel number: 0131140200040
Construction
Type & style
- Home type: SingleFamily
Materials
- concrete
- Roof: Other
Condition
- Year built: 1950
Community & HOA
Location
- Region: Miami
Financial & listing details
- Price per square foot: $373/sqft
- Tax assessed value: $283,730
- Annual tax amount: $5,144
Visit our professional directory to find a foreclosure specialist in your area that can help with your home search.
Find a foreclosure agentForeclosure details
Estimated market value
$413,300
$380,000 - $442,000
$2,943/mo
Price history
| Date | Event | Price |
|---|---|---|
| 12/19/2018 | Sold | $200,000$180/sqft |
Source: Public Record Report a problem | ||
| 9/28/2018 | Sold | $200,000-4.7%$180/sqft |
Source: Agent Provided Report a problem | ||
| 8/2/2018 | Pending sale | $209,900$189/sqft |
Source: American King Realty LLC #A10456003 Report a problem | ||
| 7/10/2018 | Listed for sale | $209,900$189/sqft |
Source: American King Realty LLC #A10456003 Report a problem | ||
| 7/9/2018 | Pending sale | $209,900$189/sqft |
Source: American King Realty LLC #A10456003 Report a problem | ||
| 6/18/2018 | Listed for sale | $209,900$189/sqft |
Source: American King Realty LLC #A10456003 Report a problem | ||
| 6/16/2018 | Pending sale | $209,900$189/sqft |
Source: American King Realty LLC #A10456003 Report a problem | ||
| 6/13/2018 | Price change | $209,900+25%$189/sqft |
Source: American King Realty LLC #A10456003 Report a problem | ||
| 4/26/2018 | Price change | $167,900-6.7%$151/sqft |
Source: American King Realty LLC #A10456003 Report a problem | ||
| 4/20/2018 | Listed for sale | $179,999+33.2%$162/sqft |
Source: American King Realty LLC #A10456003 Report a problem | ||
| 4/19/2018 | Sold | $135,100+59.1%$122/sqft |
Source: Public Record Report a problem | ||
| 4/22/2016 | Listing removed | $84,900$77/sqft |
Source: The R.E. Resource Grp., Inc. #A2153285 Report a problem | ||
| 11/25/2015 | Pending sale | $84,900$77/sqft |
Source: The R.E. Resource Grp., Inc. #A2153285 Report a problem | ||
| 10/28/2015 | Price change | $84,900-15%$77/sqft |
Source: The R.E. Resource Grp., Inc. #A2153285 Report a problem | ||
| 9/30/2015 | Price change | $99,900-9.1%$90/sqft |
Source: The R.E. Resource Grp., Inc. #A2153285 Report a problem | ||
| 8/31/2015 | Listed for sale | $109,900$99/sqft |
Source: The R.E. Resource Grp., Inc. #A2153285 Report a problem | ||
Public tax history
| Year | Property taxes | Tax assessment |
|---|---|---|
| 2025 | $5,144 +5.9% | $215,807 +10% |
| 2024 | $4,857 +6.9% | $196,189 +10% |
| 2023 | $4,546 +11.4% | $178,354 +7.3% |
| 2022 | $4,081 +12.1% | $166,184 +10% |
| 2021 | $3,641 +10.2% | $151,077 +10% |
| 2020 | $3,305 +6.8% | $137,343 +8% |
| 2019 | $3,095 +76.4% | $127,170 +139.3% |
| 2018 | $1,754 | $53,139 +10% |
| 2017 | $1,754 +13.7% | $48,309 +10% |
| 2016 | $1,543 +16.3% | $43,918 +10% |
| 2015 | $1,326 +7.2% | $39,926 +10% |
| 2014 | $1,237 +4.2% | $36,297 +10% |
| 2013 | $1,187 | $32,998 -7.7% |
| 2012 | $1,187 -30.1% | $35,733 -38.4% |
| 2011 | $1,699 -19.8% | $57,976 -19.3% |
| 2010 | $2,119 -33.5% | $71,825 -41.5% |
| 2009 | $3,188 -6.4% | $122,779 -11.7% |
| 2007 | $3,406 +32.1% | $139,081 |
| 2006 | $2,578 | -- |
| 2005 | $2,578 +22.4% | -- |
| 2004 | $2,107 +288.3% | -- |
| 2003 | $543 +6.9% | -- |
| 2002 | $508 | -- |
| 2001 | $508 | -- |
Find assessor info on the county website
Monthly payment
Estimated monthly payment$1,822
All calculations are estimates and provided by Zillow, Inc. for informational purposes only. Actual amounts may vary.
HOA fees may include property taxes on listings classified as Co-Ops. Contact the listing agent and/or owner for fee details.
Mortgage interest rates are dependent on a number of factors, including credit score, down payment, and repayment length. Interest rate data provided by Zillow Group Marketplace, Inc. as of 1/1/1970 from various mortgage lenders with which we have lead or other similar arrangements; the Estimated Payment is an average of those rates.
See how much you could borrow to make a competitive offer.
Climate risks
Neighborhood: Liberty City
Getting around
51 / 100
Good TransitNearby schools
GreatSchools rating
- 4/10Holmes Elementary SchoolGrades: PK-5Distance: 0.1 mi
- 3/10Brownsville Middle SchoolGrades: 6-8Distance: 1.6 mi
- 2/10Miami Northwestern Senior High SchoolGrades: 9-12Distance: 0.3 mi


- Florida
- Miami-Dade County
- Miami
- 33147
- Liberty City
- 1260 NW 68th St
Nearby cities
Nearby neighborhoods
Nearby zip codes
Other Miami Topics
