Rare Development Opportunity in Worcester's Booming Canal District! Serious investors take notice! Prime cleared and level 7,173 sq ft lot zoned RG-5 with signed and stamped plans in hand for a 4-family structure plus potential to build a 6-family with proper permitting. Property to face Endicott St per city guidance.(Seller has applied for new street address) All plans and permits will transfer to the new owner. Located steps from the Polar Park neighborhood and Crompton Park in one of Worcester’s fastest-growing areas. Minutes to all major highways, world - class hospitals, schools, universities, and downtown. Whether you're looking to build and hold for rental income or sell a brand-new multi family, this is an investment packed with potential. Come and be a part of Worcester's great revitalization! Seller prefers CASH/HARD MONEY.
Lot/land
$325,000
13 Sigel St, Worcester, MA 01610
--beds
0baths
7,173Square Feet
Residential
Built in ----
7,173 Square Feet Lot
$325,200 Zestimate®
$--/sqft
$-- HOA
What's special
- 26 days
- 47
- 4
Zillow last checked:
Listing updated:
Listed by:
Crystal Ryan 508-344-1343,
Real Broker MA, LLC 855-450-0442
Source: MLS PIN,MLS#: 73580026
Facts & features
Interior
Bedrooms & bathrooms
- Bathrooms: 0
Features
- Has basement: No
Property
Lot
- Size: 7,173 Square Feet
- Features: Level
Details
- Parcel number: M:05 B:021 L:00055,1765966
- Zoning: RG-5
Utilities & green energy
- Electric: On-Site
- Gas: On-Site
- Sewer: Public Sewer
- Water: Public
Community & HOA
Community
- Features: Public Transportation, Shopping, Park, Walk/Jog Trails, Medical Facility, Laundromat, Bike Path, Highway Access, House of Worship, Private School, Public School, T-Station, University
HOA
- Has HOA: No
Location
- Region: Worcester
Financial & listing details
- Tax assessed value: $123,600
- Annual tax amount: $1,630
- Date on market: 9/25/2026
- Electric utility on property: Yes
- Road surface type: Paved
Estimated market value
$325,200
$309,000 - $341,000
$2,388/mo
Price history
| Date | Event | Price |
|---|---|---|
| 9/20/2026 | Listed for sale | $325,000 |
Source: MLS PIN #73580026 Report a problem | ||
| 7/2/2026 | Listing removed | $325,000 |
Source: MLS PIN #73398939 Report a problem | ||
| 1/28/2026 | Price change | $325,000-6.9% |
Source: MLS PIN #73398939 Report a problem | ||
| 8/5/2025 | Price change | $349,000-5.4% |
Source: MLS PIN #73398939 Report a problem | ||
| 7/21/2025 | Price change | $369,000-5.1% |
Source: MLS PIN #73398939 Report a problem | ||
| 7/8/2025 | Price change | $389,000-2.5% |
Source: MLS PIN #73398939 Report a problem | ||
| 7/1/2025 | Listed for sale | $399,000+104.6% |
Source: MLS PIN #73398939 Report a problem | ||
| 8/16/2024 | Sold | $195,000+0.1% |
Source: MLS PIN #73228954 Report a problem | ||
| 6/26/2024 | Price change | $194,900-15.2% |
Source: MLS PIN #73228954 Report a problem | ||
| 4/25/2024 | Listed for sale | $229,900+434.7% |
Source: MLS PIN #73228954 Report a problem | ||
| 5/5/2017 | Sold | $43,000-13.8% |
Source: Agent Provided Report a problem | ||
| 4/21/2017 | Pending sale | $49,900 |
Source: weRENTcentralmass #72146118 Report a problem | ||
| 4/15/2017 | Listed for sale | $49,900 |
Source: weRENTcentralmass #72146118 Report a problem | ||
Public tax history
| Year | Property taxes | Tax assessment |
|---|---|---|
| 2025 | $1,630 +0.4% | $123,600 +4.7% |
| 2024 | $1,623 +12.3% | $118,000 +17.1% |
| 2023 | $1,445 +12.5% | $100,800 +19.3% |
| 2022 | $1,285 +3.9% | $84,500 +11.2% |
| 2021 | $1,237 +1.5% | $76,000 +6% |
| 2020 | $1,219 -3.4% | $71,700 +2.3% |
| 2019 | $1,262 -1.7% | $70,100 +3.2% |
| 2018 | $1,284 -15.3% | $67,900 -13.9% |
| 2017 | $1,516 +1.3% | $78,900 +8.7% |
| 2016 | $1,496 +2.7% | $72,600 |
| 2015 | $1,457 +20.8% | $72,600 +17.7% |
| 2014 | $1,206 -8.3% | $61,700 -12.9% |
| 2013 | $1,315 +0.2% | $70,800 -8.4% |
| 2012 | $1,313 +0.3% | $77,300 -10.5% |
| 2010 | $1,309 -23.1% | $86,400 -31.5% |
| 2009 | $1,702 +5% | $126,100 -2.5% |
| 2008 | $1,621 +6.2% | $129,300 +2.5% |
| 2007 | $1,526 +3.9% | $126,100 +7.6% |
| 2006 | $1,469 -18.4% | $117,200 -14.2% |
| 2005 | $1,800 +17% | $136,600 +31% |
| 2004 | $1,538 +10.6% | $104,300 +21.1% |
| 2003 | $1,391 +8.5% | $86,100 +19.9% |
| 2002 | $1,282 +17.6% | $71,800 +21.7% |
| 2000 | $1,090 -0.4% | $59,000 +0.7% |
| 1997 | $1,094 | $58,600 |
Find assessor info on the county website
Monthly payment
Climate risks
Neighborhood: 01610


Similar homes
- $275,0000.4 acres149 Plantation St, Worcester, MA 01604Lot/Land
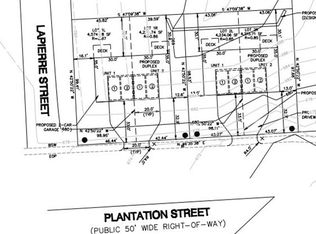 MLS ID #73588668, David Stead, RE/MAX Partners. MLS PIN
- $200,0007,500 sqft25-27 Maranda St, Worcester, MA 01604Lot/Land
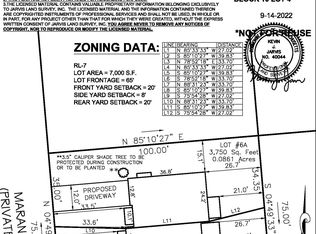 MLS ID #73571659, Anna Szeto, Anna Szeto. MLS PIN
- $200,0007,500 sqft21-23 Maranda St, Worcester, MA 01604Lot/Land
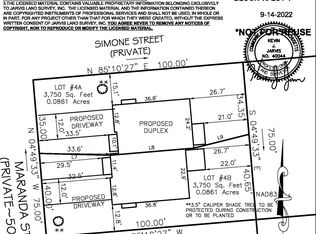 MLS ID #73571660, Anna Szeto, Anna Szeto. MLS PIN
- $349,0005.87 acres183 Main St #C, Boylston, MA 01505Lot/Land
 MLS ID #73586396, Joe Teceno, Mathieu Newton Sotheby's International Realty. MLS PIN
