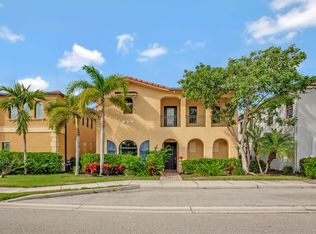
Fully furnished
This property is not currently displayed as for sale or rent on Zillow. This may be different from what's on other websites or public sources.
$543,600
$516,000 - $571,000
$4,211/mo
$4,211/mo
Rent Zestimate®
Find your next renter with Zillow Rental Manager. Plus, with online applications, you can quickly screen prospective tenants – for free.
$4,211/mo
Rent Zestimate®
$3,537/mo
Est. payment
Refinancing to a lower rate could help reduce your monthly payments and save thousands over the life of the loan.
$3,537/mo
Est. payment
Work with a Zillow partner agent
Leverage their expertise and Zillow's premium Showcase listings to get your home seen by more buyers.
Get startedList with your own agent
Get your home in front of millions of buyers by listing it on Zillow.
Learn how to do itSell it yourself
Take full control of how buyers see your home on Zillow by listing For Sale by Owner (FSBO).
List your homeFully furnished
This property is not currently displayed as for sale or rent on Zillow. This may be different from what's on other websites or public sources.
Zillow last checked:
Listing updated:
| Date | Event | Price |
|---|---|---|
| 9/25/2026 | Listing removed | $3,300$1/sqft |
Source: Zillow Rentals Report a problem | ||
| 7/31/2026 | Price change | $3,300-5.7%$1/sqft |
Source: Zillow Rentals Report a problem | ||
| 7/29/2026 | Listed for rent | $3,500$2/sqft |
Source: Zillow Rentals Report a problem | ||
| 5/21/2026 | Listing removed | $575,000$248/sqft |
Source:  SWFLMLS #225074795 Report a problem | ||
| 4/29/2026 | Listing removed | $3,500$2/sqft |
Source: Zillow Rentals Report a problem | ||
| 3/23/2026 | Listed for rent | $3,500$2/sqft |
Source: Zillow Rentals Report a problem | ||
| 12/28/2025 | Price change | $575,000-4%$248/sqft |
Source: SWFLMLS #225074795 Report a problem | ||
| 10/13/2025 | Listed for sale | $599,000-7.8%$259/sqft |
Source: SWFLMLS #225074795 Report a problem | ||
| 10/9/2025 | Listing removed | $3,500$2/sqft |
Source: Zillow Rentals Report a problem | ||
| 10/1/2025 | Listed for rent | $3,500$2/sqft |
Source: Zillow Rentals Report a problem | ||
| 8/25/2025 | Listing removed | $3,500$2/sqft |
Source: NABOR FL #225065307 Report a problem | ||
| 8/12/2025 | Listing removed | $649,900$281/sqft |
Source: SWFLMLS #225004439 Report a problem | ||
| 7/31/2025 | Listed for rent | $3,500+34.6%$2/sqft |
Source: NABOR FL #225065307 Report a problem | ||
| 4/1/2025 | Price change | $649,9000%$281/sqft |
Source: SWFLMLS #225004439 Report a problem | ||
| 1/15/2025 | Listed for sale | $650,000-1.5%$281/sqft |
Source: SWFLMLS #225004439 Report a problem | ||
| 9/27/2021 | Listing removed | -- |
Source: SWFLMLS #221046098 Report a problem | ||
| 8/11/2021 | Price change | $660,000-4.3%$285/sqft |
Source: SWFLMLS #221046098 Report a problem | ||
| 8/6/2021 | Price change | $689,900-1.4%$298/sqft |
Source: SWFLMLS #221046098 Report a problem | ||
| 6/28/2021 | Listed for sale | $699,900+55.5%$302/sqft |
Source: SWFLMLS #221046098 Report a problem | ||
| 11/19/2020 | Listing removed | $449,999$194/sqft |
Source: RE/MAX Affinity Plus #220035196 Report a problem | ||
| 8/20/2020 | Price change | $449,999-9.1%$194/sqft |
Source: Re/Max Affinity Plus #220035196 Report a problem | ||
| 5/31/2020 | Price change | $495,000+16.5%$214/sqft |
Source: Re/Max Affinity Plus #220020773 Report a problem | ||
| 3/15/2020 | Listing removed | $2,600$1/sqft |
Source: Easy Living Property Services #219073489 Report a problem | ||
| 3/15/2020 | Listed for sale | $424,999+42.4%$184/sqft |
Source: RE/MAX AFFINITY PLUS #2200707 Report a problem | ||
| 2/17/2020 | Listed for rent | $2,600$1/sqft |
Source: Easy Living Property Services #219073489 Report a problem | ||
| 11/1/2017 | Sold | $298,500$129/sqft |
Source: Public Record Report a problem | ||
| Year | Property taxes | Tax assessment |
|---|---|---|
| 2025 | $4,826 +14.6% | $431,901 +10% |
| 2024 | $4,209 +68.4% | $392,637 +39.2% |
| 2023 | $2,500 -2.5% | $281,994 +3% |
| 2022 | $2,565 -0.8% | $273,781 +3% |
| 2021 | $2,586 +2.5% | $265,807 +1.4% |
| 2020 | $2,524 +1.9% | $262,137 +2.3% |
| 2019 | $2,476 -4.2% | $256,243 -3.7% |
| 2018 | $2,585 -7.6% | $266,202 -0.2% |
| 2017 | $2,798 -14.3% | $266,818 +368.7% |
| 2016 | $3,265 +398.6% | $56,930 -14.5% |
| 2015 | $655 -15.8% | $66,597 +583% |
| 2014 | $777 +568.2% | $9,750 |
| 2013 | $116 -1.3% | $9,750 |
| 2012 | $118 +0.5% | $9,750 |
| 2011 | $117 -67% | $9,750 -35% |
| 2010 | $356 -81.6% | $15,000 -50% |
| 2009 | $1,934 | $30,000 -82.9% |
| 2008 | $1,934 +87.1% | $175,000 +110.5% |
| 2007 | $1,034 | $83,146 |
| 2006 | -- | $83,146 |