Approximately 1.03 acres located in East El Paso. All Utilities Included. Fronting North Loop Drive and Located on North Loop Drive and Eastwind Ave Intersection. High Visibility Location with Quick Access to Interstate 10 via Eastwind Ave. Ideal for Commercial Developments in Highly Coveted Area. Multi-Family Development Expected to Come to the Surrounding Area, Location Benefits from Increasing Population.
Pending
$540,000
13001 N Loop Dr, Clint, TX 79836
--beds
0baths
1.03Acres
Land
Built in ----
1.03 Acres Lot
$-- Zestimate®
$--/sqft
$-- HOA
What's special
Fronting north loop driveHigh visibility location
- 47 days
- 1
- 0
Zillow last checked:
Listing updated:
Listed by:
Fabian Uribe 0667251 915-433-1721,
Team Juan Uribe,
Sebastian Alcazar 0719657 915-478-9905,
Team Juan Uribe
Source: GEPAR,MLS#: 951589
Facts & features
Interior
Bedrooms & bathrooms
- Bathrooms: 0
Video & virtual tour
Property
Lot
- Size: 1.03 Acres
- Topography: Mostly Level
Details
- Parcel number: S07500002300106
- Zoning: Out of Area
Utilities & green energy
- Water: Public
- Utilities for property: All City
Community & HOA
Community
- Subdivision: Socorro
Location
- Region: Clint
Financial & listing details
- Tax assessed value: $513,877
- Annual tax amount: $456
- Date on market: 9/22/2026
- Cumulative days on market: 47 days
- Listing terms: Cash,Contract,Conventional
Estimated market value
Not available
Estimated sales range
Not available
Not available
Price history
| Date | Event | Price |
|---|---|---|
| 10/1/2026 | Pending sale | $540,000 |
Source:  GEPAR #951589 Report a problem | ||
| 9/22/2026 | Listed for sale | $540,000 |
Source: GEPAR #951589 Report a problem | ||
Public tax history
| Year | Property taxes | Tax assessment |
|---|---|---|
| 2026 | -- | $513,877 -8.6% |
| 2025 | $12,311 +404.4% | $562,202 +386.6% |
| 2024 | $2,441 -3.6% | $115,532 -0.4% |
| 2023 | $2,533 +1.5% | $115,949 +9.8% |
| 2022 | $2,496 +13.2% | $105,618 +18.8% |
| 2021 | $2,205 -51.5% | $88,903 -49.5% |
| 2020 | $4,547 +5.1% | $176,156 |
| 2019 | $4,327 -3.5% | $176,156 -1.8% |
| 2018 | $4,484 +4.8% | $179,436 +6.1% |
| 2017 | $4,278 +4.2% | $169,058 +3.5% |
| 2016 | $4,104 -5% | $163,337 |
| 2015 | $4,320 | $163,337 -8% |
| 2014 | $4,320 | $177,547 +0.3% |
| 2013 | -- | $176,947 +4% |
| 2011 | -- | $170,188 0% |
| 2010 | -- | $170,245 -1.7% |
| 2009 | -- | $173,262 |
| 2006 | -- | -- |
| 2005 | -- | -- |
| 2003 | -- | -- |
| 2001 | -- | -- |
Find assessor info on the county website
Monthly payment
Est. payment
Payment breakdown
Explore the cost of this home by adjusting the details. Changes won't be saved.Climate risks
Neighborhood: 79836
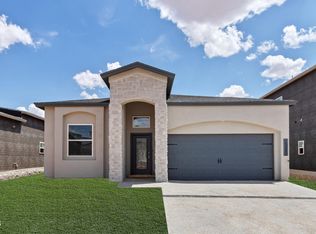
Similar homes
- $540,0001.03 acres12545 N Loop Dr, Clint, TX 79836Lot/Land
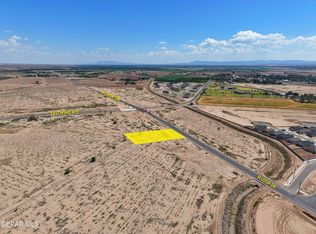
 MLS ID #951551, Fabian Uribe, Team Juan Uribe. GEPAR
- $540,0001.03 acres12537 N Loop Dr, Clint, TX 79836Lot/Land
 MLS ID #951549, Fabian Uribe, Team Juan Uribe. GEPAR
- $540,0001.03 acres12529 N Loop Dr, Clint, TX 79836Lot/Land
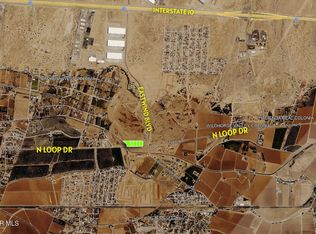 MLS ID #951547, Juan Uribe, Team Juan Uribe. GEPAR
- $553,6401.59 acres12641 N Loop Dr, Clint, TX 79836Lot/Land
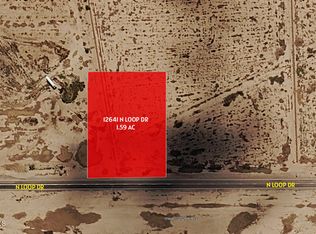 MLS ID #951523, Sebastian Alcazar, Team Juan Uribe. GEPAR
- $600,0001.14 acres12636 N Loop Dr, Clint, TX 79836Lot/LandMLS ID #951202, Sebastian Alcazar, Team Juan Uribe. GEPAR
- $600,0001.14 acres12648 N Loop Dr, Clint, TX 79836Lot/LandMLS ID #951205, Sebastian Alcazar, Team Juan Uribe. GEPAR
- $600,0001.14 acres12660 N Loop Dr, Clint, TX 79836Lot/LandMLS ID #951206, Fabian Uribe, Team Juan Uribe. GEPAR
- $514,4961.48 acres12649 N Loop Dr, Clint, TX 79836Lot/LandMLS ID #951520, Fabian Uribe, Team Juan Uribe. GEPAR
- $300,0001.14 acres12612 N Loop Dr, Clint, TX 79836Lot/LandMLS ID #951198, Sebastian Alcazar, Team Juan Uribe. GEPAR
- $400,0001.14 acres12624 N Loop Dr, Clint, TX 79836Lot/LandMLS ID #951199, Fabian Uribe, Team Juan Uribe. GEPAR
- $648,0001.24 acres12709 N Loop Dr, Clint, TX 79836Lot/LandMLS ID #951532, Fabian Uribe, Team Juan Uribe. GEPAR
- $784,3501.29 acres12600 N Loop Dr, Clint, TX 79836Lot/LandMLS ID #951196, Sebastian Alcazar, Team Juan Uribe. GEPAR
- $753,2981.24 acres12701 N Loop Dr, Clint, TX 79836Lot/LandMLS ID #951526, Fabian Uribe, Team Juan Uribe. GEPAR
- $600,0005 acres79 TSP 3 SEC LOT 19, El Paso, TX 79928Lot/Land
 MLS ID #1913096, Vanessa McQuade TREC #533392, Clark Realty & Associates,LLC. LERA MLS
- $628,50012.57 acres28 San Elizario, San Elizario, TX 79849Lot/LandMLS ID #947673, Brian J Burds, eXp Realty LLC. GEPAR
- $575,0003.39 acres200 Place Rd, El Paso, TX 79927Lot/LandMLS ID #942745, Hector A Hernandez, Sandra Luna & Associates. GEPAR
- $365,0005 acresPn #398074, El Paso, TX 79928Lot/LandMLS ID #937461, Lizette Jaquez, Camacho Real Estate. GEPAR
- $550,0006.42 acresPn 244180 Alameda Ave, Fabens, TX 79838Lot/LandMLS ID #951043, Lynne Stone, Coldwell Banker Apex REALTORS. GEPAR
- $380,0008.74 acres13400 Socorro Rd, San Elizario, TX 79849Lot/LandMLS ID #949889, Luis Lerma, KasasHomes Real Estate LLC. GEPAR
- $795,0002.04 acres11875 N Loop Dr, El Paso, TX 79927Lot/LandMLS ID #946281, Elisa Marie Chacon, Limelight Real Estate Firm. GEPAR
