Attention Investors, Contractors this is the Handy Man Special! This 2 family currently has a long term tenant on the first floor and a vacant second floor apartment with a ton of potential! The roof is newer along with the Vinyl and the Windows on the first floor have also be replaced. The second floor of the building is currently to the studs and is a clean slate for the right investor! The seller is looking to sell this building before the winter and is open to receiving any and ALL offers!
Pending
$109,900
132 Lonsdale St, Fall River, MA 02721
4beds
1,600sqft
2 Family - 2 Units Up/Down
Built in 1900
-- sqft lot
$562,000 Zestimate®
$69/sqft
$-- HOA
What's special
- 86 days
- 18
- 0
Zillow last checked:
Listing updated:
Listed by:
Gualter Amarelo 774-526-4796,
Cameron Real Estate Group - Fall River 508-617-4848,
Tracy Church 401-489-5784
Source: MLS PIN,MLS#: 72417147
Facts & features
Interior
Bedrooms & bathrooms
- Bedrooms: 4
- Bathrooms: 2
- Full bathrooms: 2
Features
- Has basement: No
- Has fireplace: No
Interior area
- Total structure area: 1,600
- Total interior livable area: 1,600 sqft
Property
Parking
- Parking features: Paved Drive, Shared Driveway
- Has uncovered spaces: Yes
Lot
- Size: 4,000 Square Feet
Details
- Parcel number: FALLM0I17B0000L0037
- Zoning: a-3
Construction
Type & style
- Home type: MultiFamily
- Property subtype: 2 Family - 2 Units Up/Down
Materials
- Foundation: Concrete Perimeter
Condition
- Year built: 1900
Utilities & green energy
- Sewer: Public Sewer
- Water: Public
Community & HOA
Location
- Region: Fall River
Financial & listing details
- Price per square foot: $69/sqft
- Tax assessed value: $313,600
- Annual tax amount: $4,584
- Date on market: 8/2/2026
- Total actual rent: 750
Estimated market value
$562,000
$528,000 - $601,000
$2,206/mo
Price history
| Date | Event | Price |
|---|---|---|
| 9/23/2026 | Pending sale | $109,900-75.6%$69/sqft |
Source: MLS PIN #72417147 Report a problem | ||
| 6/11/2024 | Contingent | $449,999$281/sqft |
Source: MLS PIN #73247124 Report a problem | ||
| 6/5/2024 | Listed for sale | $449,999+67.3%$281/sqft |
Source: MLS PIN #73247124 Report a problem | ||
| 5/21/2021 | Pending sale | $269,000$168/sqft |
Source: MLS PIN #72819794 Report a problem | ||
| 5/7/2021 | Contingent | $269,000$168/sqft |
Source: MLS PIN #72819794 Report a problem | ||
| 4/23/2021 | Listed for sale | $269,000+64.5%$168/sqft |
Source: MLS PIN #72819794 Report a problem | ||
| 2/6/2020 | Sold | $163,500+77.7%$102/sqft |
Source: Public Record Report a problem | ||
| 4/11/2019 | Sold | $92,000-76.9%$58/sqft |
Source: Public Record Report a problem | ||
| 6/29/2018 | Sold | $398,900$249/sqft |
Source: Public Record Report a problem | ||
Public tax history
| Year | Property taxes | Tax assessment |
|---|---|---|
| 2025 | $3,560 +9.9% | $310,900 +10.3% |
| 2024 | $3,238 +12.1% | $281,800 +19.7% |
| 2023 | $2,888 +7.6% | $235,400 +10.7% |
| 2022 | $2,683 +10% | $212,600 +20.6% |
| 2021 | $2,438 +10.4% | $176,300 +15.4% |
| 2020 | $2,208 -55.4% | $152,800 -55% |
| 2019 | $4,946 +7.9% | $339,200 +8.2% |
| 2018 | $4,585 +5.7% | $313,600 +1.3% |
| 2017 | $4,336 +0.2% | $309,700 -2.4% |
| 2016 | $4,326 +5.4% | $317,400 +1.1% |
| 2015 | $4,106 -4.6% | $313,900 -8.3% |
| 2014 | $4,305 +3.9% | $342,200 -1.5% |
| 2013 | $4,144 +7.9% | $347,400 -0.7% |
| 2012 | $3,842 -1.8% | $349,900 -19.2% |
| 2010 | $3,914 +3.3% | $433,000 -7.9% |
| 2009 | $3,790 -5% | $470,200 -9.6% |
| 2008 | $3,991 +7.5% | $520,300 +0.6% |
| 2007 | $3,712 +11.1% | $517,000 +5.7% |
| 2006 | $3,340 +14.1% | $489,000 +27.1% |
| 2005 | $2,928 +41.7% | $384,700 +52.9% |
| 2004 | $2,066 +19.6% | $251,600 +56% |
| 2003 | $1,728 +8.9% | $161,300 |
| 2002 | $1,587 -8.7% | $161,300 -2.9% |
| 2000 | $1,738 +18.1% | $166,200 +3.6% |
| 1995 | $1,472 | $160,400 |
Find assessor info on the county website
Monthly payment
Est. payment
Payment breakdown
Explore the cost of this home by adjusting the details. Changes won't be saved.Climate risks
Neighborhood: Niagara


Similar homes
- $142,0002 bd1 ba840 sqft6 Northway, Taunton, MA 02780For Sale
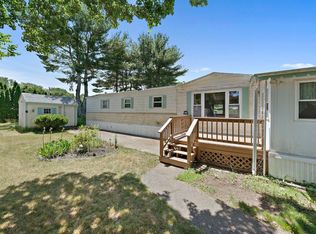 MLS ID #73541661, Kenneth Mitchell, Kenneth Allen Realty. MLS PIN
- $149,0002 bd1 ba840 sqft22 Thayer Dr, Taunton, MA 02780For Sale
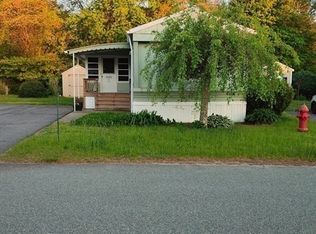 MLS ID #73567752, Peyton Brant, Doherty Realty Company. MLS PIN
- $159,9003 bd2 ba980 sqft36 Catherine Dr, Attleboro, MA 02703For Sale
 MLS ID #73540107, Kyle Seyboth, Century 21 Limitless. MLS PIN
- $159,9002 bd1 ba828 sqft106 Lucy Dr, Attleboro, MA 02703For Sale
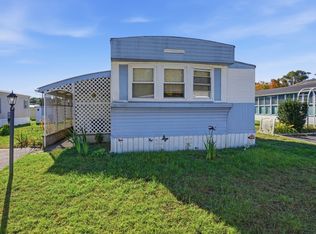 MLS ID #73588448, Catherine Edington, The Mello Group, Inc.. MLS PIN
- $150,0001 bd1 ba830 sqftLaurelmead, Providence, RI 02906For Sale
 MLS ID #1423658, David White, OwnerEntry.com. StateWide MLS RI
