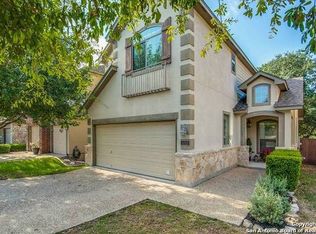
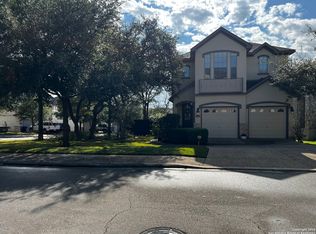
This 2209 square foot single family home has 3 bedrooms and 3.0 bathrooms. This home is located at 1322 Whitby Tower, San Antonio, TX 78258.
Pre-foreclosure

Est. $371,700
1322 Whitby Tower, San Antonio, TX 78258
3beds
3baths
2,209sqft
SingleFamily
Built in 2009
-- sqft lot
$371,700 Zestimate®
$168/sqft
$-- HOA
Overview
- 35 days
- 122
- 5
Zillow last checked:
Source: Hubzu REO,MLS#: 87916941503
Facts & features
Interior
Bedrooms & bathrooms
- Bedrooms: 3
- Bathrooms: 3
Interior area
- Total structure area: 2,209
- Total interior livable area: 2,209 sqft
Property
Details
- Parcel number: 1108132
Construction
Type & style
- Home type: SingleFamily
Condition
- Year built: 2009
Community & HOA
Location
- Region: San Antonio
Financial & listing details
- Price per square foot: $168/sqft
- Tax assessed value: $384,090
- Date on market: 6/4/2024
- Lease term: Contact For Details

Foreclosure details
Estimated market value
$371,700
$353,000 - $390,000
$2,467/mo
Price history
| Date | Event | Price |
|---|---|---|
| 7/24/2024 | Listing removed | -- |
Source:  Hubzu REO #87916941503 Report a problem | ||
| 6/4/2024 | Pending sale | -- |
Source: Hubzu REO #87916941503 Report a problem | ||
| 9/29/2023 | Listing removed | -- |
Source:  LERA MLS #1707206 Report a problem | ||
| 9/18/2023 | Price change | $350,000-1.4%$158/sqft |
Source: LERA MLS #1707206 Report a problem | ||
| 7/29/2023 | Listed for sale | $355,000-1.1%$161/sqft |
Source: LERA MLS #1707206 Report a problem | ||
| 6/22/2023 | Listing removed | -- |
Source: LERA MLS #1682819 Report a problem | ||
| 5/22/2023 | Pending sale | $359,000$163/sqft |
Source: LERA MLS #1682819 Report a problem | ||
| 5/16/2023 | Contingent | $359,000$163/sqft |
Source: LERA MLS #1682819 Report a problem | ||
| 4/25/2023 | Listed for sale | $359,000-1.6%$163/sqft |
Source: LERA MLS #1682819 Report a problem | ||
| 4/15/2023 | Listing removed | -- |
Source: LERA MLS #1670709 Report a problem | ||
| 4/3/2023 | Price change | $365,000-2.6%$165/sqft |
Source: LERA MLS #1670709 Report a problem | ||
| 3/24/2023 | Price change | $374,888-2.6%$170/sqft |
Source: LERA MLS #1670709 Report a problem | ||
| 3/2/2023 | Price change | $384,888-2.5%$174/sqft |
Source: LERA MLS #1670709 Report a problem | ||
| 12/27/2022 | Price change | $394,888-1.5%$179/sqft |
Source: LERA MLS #1646154 Report a problem | ||
| 10/20/2022 | Listed for sale | $401,000$182/sqft |
Source: LERA MLS #1646154 Report a problem | ||
Public tax history
| Year | Property taxes | Tax assessment |
|---|---|---|
| 2026 | -- | $384,090 -4.7% |
| 2025 | $6,849 +1.6% | $402,890 +6.4% |
| 2024 | $6,743 +9.3% | $378,709 +10% |
| 2023 | $6,167 | $344,281 +10% |
| 2022 | -- | $312,983 +10% |
| 2021 | $6,570 | $284,530 +5.8% |
| 2020 | $6,570 +2.8% | $268,950 +3.4% |
| 2019 | $6,391 | $260,000 +0.6% |
| 2018 | $6,391 +2.7% | $258,560 +5.1% |
| 2017 | $6,225 +0.2% | $245,960 +1.1% |
| 2016 | $6,210 +10.6% | $243,350 +4.9% |
| 2015 | $5,615 | $232,080 +10% |
| 2014 | $5,615 | $211,070 +0.6% |
| 2013 | -- | $209,890 +3.3% |
| 2012 | -- | $203,100 -0.8% |
| 2011 | -- | $204,720 |
| 2010 | -- | $204,720 +966.3% |
| 2009 | -- | $19,200 -20% |
| 2008 | -- | $24,000 |
Find assessor info on the county website