Investment Opportunity near Downtown-Duplex priced to sell! This property features two separate units, offering potential for rental Income, Multigenerational living, or an investment opportunity.*Unit 1:2 bed, 1 bath 748 sf, *Unit 2: 1bed,1bath 748sq ft.
Active
$599,900
1331 D St, Sacramento, CA 95814
3beds
1,496sqft
Duplex
Built in 1898
-- sqft lot
$583,000 Zestimate®
$401/sqft
$-- HOA
What's special
Two separate units
- 3 days
- 157
- 11
Likely to sell faster than
Zillow last checked:
Listing updated:
Listed by:
Sandra Huerta DRE #01758200 530-383-2706,
American Home Finance & Lending
Source: MetroList Services of CA,MLS#: 226128500Originating MLS: MetroList Services, Inc.
Facts & features
Interior
Bedrooms & bathrooms
- Bedrooms: 3
- Bathrooms: 2
- Full bathrooms: 2
Heating
- Wall Furnace
Cooling
- Ceiling Fan(s), Wall Unit(s)
Appliances
- Laundry: Other
Features
- Flooring: Tile, Wood
- Has fireplace: No
Interior area
- Total interior livable area: 1,496 sqft
Property
Parking
- Total spaces: 2
- Parking features: Permit Required
Lot
- Size: 3,049 Square Feet
- Features: None
Details
- Parcel number: 00200840060000
- Zoning: R3A
- Special conditions: Standard
Construction
Type & style
- Home type: MultiFamily
- Property subtype: Duplex
Materials
- Frame, Wood
- Foundation: Raised, Concrete
Condition
- Year built: 1898
Utilities & green energy
- Sewer: Public Sewer
- Water: Public
- Utilities for property: City
Community & HOA
Location
- Region: Sacramento
Financial & listing details
- Price per square foot: $401/sqft
- Tax assessed value: $443,795
- Price range: $599.9K - $599.9K
- Date on market: 10/15/2026
- Income includes: Rent Only
Estimated market value
$583,000
$554,000 - $612,000
$2,600/mo
Price history
| Date | Event | Price |
|---|---|---|
| 10/15/2026 | Listed for sale | $599,900+46.3%$401/sqft |
Source: MetroList Services of CA #226128500 Report a problem | ||
| 1/31/2022 | Sold | $410,000$274/sqft |
Source: Public Record Report a problem | ||
| 11/2/2021 | Sold | $410,000+2.5%$274/sqft |
Source:  MetroList Services of CA #221129194 Report a problem | ||
| 10/17/2021 | Pending sale | $400,000$267/sqft |
Source: MetroList Services of CA #221129194 Report a problem | ||
| 10/9/2021 | Listed for sale | $400,000+164%$267/sqft |
Source: MetroList Services of CA #221129194 Report a problem | ||
| 4/14/2011 | Sold | $151,500+4.6%$101/sqft |
Source: MetroList Services of CA #11021128 Report a problem | ||
| 3/23/2011 | Price change | $144,900-4.6%$97/sqft |
Source: foreclosure.com Report a problem | ||
| 1/28/2011 | Price change | $151,900-4.4%$102/sqft |
Source: foreclosure.com Report a problem | ||
| 1/2/2011 | Price change | $158,900-4.8%$106/sqft |
Source: foreclosure.com Report a problem | ||
| 12/4/2010 | Price change | $166,900-5%$112/sqft |
Source: foreclosure.com Report a problem | ||
| 11/11/2010 | Price change | $175,655-5%$117/sqft |
Source: foreclosure.com Report a problem | ||
| 10/20/2010 | Price change | $184,900-4.1%$124/sqft |
Source: foreclosure.com Report a problem | ||
| 9/22/2010 | Listed for sale | $192,780-19.7%$129/sqft |
Source: foreclosure.com Report a problem | ||
| 7/27/2010 | Sold | $240,000-11.1%$160/sqft |
Source: Public Record Report a problem | ||
| 10/28/2003 | Sold | $270,000+575%$180/sqft |
Source: Public Record Report a problem | ||
| 3/12/2001 | Sold | $40,000$27/sqft |
Source: Public Record Report a problem | ||
Public tax history
| Year | Property taxes | Tax assessment |
|---|---|---|
| 2026 | -- | $443,795 +2% |
| 2025 | $5,331 +1.4% | $435,094 +2% |
| 2024 | $5,257 +2.4% | $426,564 +2% |
| 2023 | $5,133 +1.7% | $418,200 +2% |
| 2022 | $5,046 -1.9% | $410,000 -2.6% |
| 2021 | $5,143 -25.8% | $421,052 +1% |
| 2020 | $6,927 +39.8% | $416,736 +2% |
| 2019 | $4,956 +2.7% | $408,565 +2% |
| 2018 | $4,828 +1.4% | $400,554 +2% |
| 2017 | $4,761 +125.2% | $392,700 +139.5% |
| 2016 | $2,115 +1.5% | $163,959 +1.5% |
| 2015 | $2,083 +2.6% | $161,497 +2% |
| 2014 | $2,030 | $158,334 +0.5% |
| 2013 | -- | $157,619 +2% |
| 2012 | -- | $154,530 -35.1% |
| 2011 | -- | $238,256 |
| 2010 | -- | $238,256 -15.3% |
| 2008 | -- | $281,430 +2% |
| 2007 | -- | $275,913 +2% |
| 2006 | -- | $270,504 +2% |
| 2005 | -- | $265,200 -1.8% |
| 2004 | -- | $270,000 +548.8% |
| 2003 | -- | $41,616 +2% |
| 2002 | -- | $40,800 +76.2% |
| 2001 | -- | $23,162 +2% |
| 2000 | -- | $22,709 |
Find assessor info on the county website
Monthly payment
Est. payment
Payment breakdown
Explore the cost of this home by adjusting the details. Changes won't be saved.Climate risks
Neighborhood: Mansion Flats


Similar homes
- $650,0002 bd1 ba1.1k sqft2326-2330 32nd St, Sacramento, CA 95817For Sale
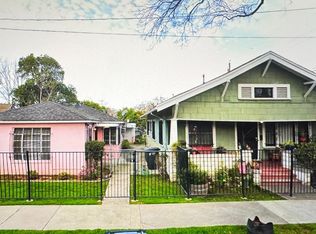 MLS ID #226121920, Melissa Heede. MetroList Services of CA
- $565,0004 bd2 ba1.8k sqft1230-1232 Clinton Rd, Sacramento, CA 95825For Sale
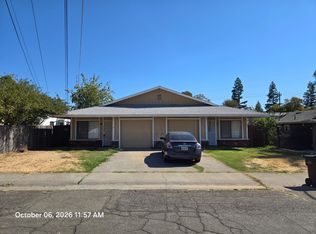 MLS ID #226125070, Grady McFaddin. MetroList Services of CA
- $599,0004 bd1 ba1.7k sqft964 33rd St, Sacramento, CA 95816For Sale
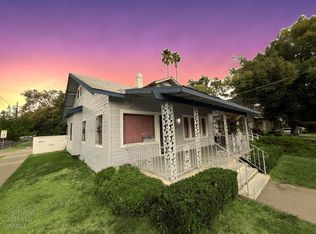 MLS ID #226124534, Devin Jensen. MetroList Services of CA
- $620,0003 bd2 ba1.4k sqft1140 8th Ave, Sacramento, CA 95818For Sale
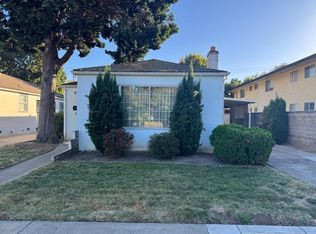 MLS ID #226124613, Tammy Novoa. MetroList Services of CA
