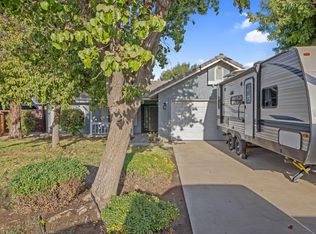
Welcome Home! This charming three-bedroom, two-bath corner lot home features space to park your RV, stamped concrete, a covered patio that's perfect for entertaining. Enjoy a spacious shady backyard with mature pomegranate, orange, and passion fruit trees, creating your own private outdoor retreat. Conveniently located near Neighborhood Walmart, Vallarta supermarket, Costco, schools, shopping, dining, and everyday amenities. Don't miss this opportunity to make it yours! Buyers and buyer's Agent to verify all information.
For sale
Price increase: $10K (10/21)
$335,000
1338 N Mooney Boulevard, Visalia, CA 93291
3beds
1,540sqft
Single Family Residence, Residential
Built in 1957
7,117 Square Feet Lot
$334,000 Zestimate®
$218/sqft
$-- HOA
What's special
Spacious shady backyardPrivate outdoor retreatCorner lot
- 98 days
- 629
- 65
Zillow last checked:
Listing updated:
Listed by:
Fabi Orozco 559-556-3132,
Real Brokerage Technologies
Source: TCMLS,MLS#: 243282
Facts & features
Interior
Bedrooms & bathrooms
- Bedrooms: 3
- Bathrooms: 2
- Full bathrooms: 2
Heating
- Central
Cooling
- Central Air, Wall/Window Unit(s)
Features
- Has fireplace: Yes
- Fireplace features: Family Room
Interior area
- Total structure area: 1,540
- Total interior livable area: 1,540 sqft
Property
Features
- Stories: 1
Lot
- Size: 7,117 Square Feet
Details
- Parcel number: 93041002000
- Zoning: R1-5
- Zoning description: R1-5
Construction
Type & style
- Home type: SingleFamily
- Property subtype: Single Family Residence, Residential
Materials
- Roof: Composition
Condition
- New construction: No
- Year built: 1957
Utilities & green energy
- Sewer: Public Sewer
- Water: Public
- Utilities for property: Electricity Connected, Sewer Connected, Water Connected
Community & HOA
Community
- Security: 24 Hour Security
HOA
- Has HOA: No
Location
- Region: Visalia
Financial & listing details
- Price per square foot: $218/sqft
- Tax assessed value: $303,079
- Date on market: 10/19/2026
- Cumulative days on market: 100 days
- Electric utility on property: Yes
Estimated market value
$334,000
$317,000 - $351,000
$1,937/mo
Price history
| Date | Event | Price |
|---|---|---|
| 10/21/2026 | Price change | $345,000+3%$224/sqft |
Source: Fresno MLS #653250 Report a problem | ||
| 10/19/2026 | Listed for sale | $335,000$218/sqft |
Source:  TCMLS #243282 Report a problem | ||
| 10/14/2026 | Pending sale | $335,000$218/sqft |
Source: TCMLS #243282 Report a problem | ||
| 9/11/2026 | Price change | $335,000-2.9%$218/sqft |
Source: TCMLS #243282 Report a problem | ||
| 8/3/2026 | Listed for sale | $345,000+23.2%$224/sqft |
Source: TCMLS #243282 Report a problem | ||
| 7/6/2021 | Sold | $280,000$182/sqft |
Source: TCMLS #209897 Report a problem | ||
| 4/28/2021 | Listed for sale | $280,000$182/sqft |
Source:  Fresno MLS #554516 Report a problem | ||
| 4/6/2021 | Listing removed | -- |
Source: Local MLS Report a problem | ||
| 3/8/2021 | Listed for sale | $280,000+16.7%$182/sqft |
Source: Guarantee Real Estate #554516 Report a problem | ||
| 11/7/2019 | Listing removed | $240,000$156/sqft |
Source: Guarantee Real Estate #531123 Report a problem | ||
| 9/26/2019 | Listed for sale | $240,000+336.4%$156/sqft |
Source: Guarantee Real Estate #531123 Report a problem | ||
| 10/4/2012 | Sold | $55,000$36/sqft |
Source: TCMLS #95137 Report a problem | ||
| 6/23/2012 | Pending sale | $55,000$36/sqft |
Source: CENTURY 21 Jordan-Link & Company #95137 Report a problem | ||
| 5/22/2012 | Price change | $55,000-21.4%$36/sqft |
Source: Century 21 Jordan-Link & Co. #95137 Report a problem | ||
| 3/15/2012 | Listed for sale | $70,000-33.3%$45/sqft |
Source: Century 21 Jordan-Link & Co. #95137 Report a problem | ||
| 11/10/2003 | Sold | $105,000$68/sqft |
Source: Public Record Report a problem | ||
Public tax history
| Year | Property taxes | Tax assessment |
|---|---|---|
| 2026 | -- | $303,079 +2% |
| 2025 | $3,223 +3% | $297,137 +2% |
| 2024 | $3,130 +2.8% | $291,312 +2% |
| 2023 | $3,044 +3.2% | $285,600 +2% |
| 2022 | $2,951 +338.2% | $280,000 +347.5% |
| 2021 | $673 +2.1% | $62,571 +1% |
| 2020 | $659 +1.5% | $61,930 +2% |
| 2019 | $649 +4% | $60,715 +2% |
| 2018 | $624 -0.4% | $59,524 +2% |
| 2017 | $627 +3.4% | $58,357 +2% |
| 2016 | $606 | $57,213 +1.5% |
| 2015 | $606 +2.9% | $56,353 +2% |
| 2014 | $589 | $55,250 +0.5% |
| 2013 | -- | $55,000 -30.4% |
| 2012 | -- | $79,000 -10.2% |
| 2011 | -- | $88,000 -21% |
| 2007 | -- | $111,427 +2% |
| 2006 | -- | $109,242 +2% |
| 2005 | -- | $107,100 +2% |
| 2004 | -- | $105,000 +244.8% |
| 2003 | -- | $30,452 +2% |
| 2002 | -- | $29,855 +2% |
| 2001 | -- | $29,270 |
Find assessor info on the county website
Monthly payment
Est. payment
Payment breakdown
Explore the cost of this home by adjusting the details. Changes won't be saved.Climate risks
Neighborhood: 93291


Similar homes
- $334,9993 bd2 ba1.1k sqft2035 W Oriole Ave, Visalia, CA 93291For Sale
 MLS ID #651171, Dimitria I. Silagan. Fresno MLS
- $345,0003 bd2 ba1.2k sqft2432 N Summers Court, Visalia, CA 93291For Sale
 MLS ID #244491, Deanna Enriquez Bueno, Century 21 Select Real Estate. TCMLS
- $439,0003 bd2 ba1.5k sqft1420 N Linda Vista Court, Visalia, CA 93291For Sale
 MLS ID #244915, Matt Thompson, Century 21 Select Real Estate. TCMLS
- $358,0004 bd2 ba1.5k sqft1919 N Bridge Street, Visalia, CA 93291For Sale
 MLS ID #242345, Alex Chavez Guerrero, Realty Concepts, Ltd. - Fresno. TCMLS
