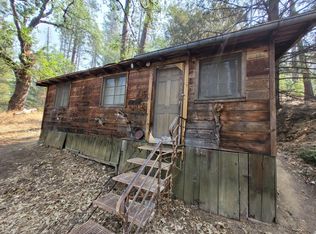
Escape to your private 53-acre sanctuary in the scenic Hayfork Valley! This unique property offers a charming tiny home, well and a creek flowing through all usable land. Imagine peaceful days with your horses grazing on the abundant pasture, while a seasonal pond adds to the natural beauty. Towering trees provide shade and privacy, creating a tranquil retreat. This is more than just land; it's a lifestyle opportunity for those seeking a connection with nature in a truly special setting. Embrace the privacy and endless possibilities this Hayfork Valley gem affords. Explore your rural dream!
For sale
$250,000
13660 State Highway 3, Hayfork, CA 96041
1beds
360sqft
Single Family Residence
Built in 2021
53 Acres Lot
$-- Zestimate®
$694/sqft
$-- HOA
What's special
Abundant pastureCharming tiny homeSeasonal pond
- 38 days
- 490
- 115
Zillow last checked:
Listing updated:
Listed by:
Retta Treanor 530-410-1992,
Big Valley Properties
Source: SMLS,MLS#: 26-5364
Facts & features
Interior
Bedrooms & bathrooms
- Bedrooms: 1
- Bathrooms: 1
- Full bathrooms: 1
Heating
- Electric
Cooling
- None
Features
- Flooring: Laminate
- Has basement: No
Interior area
- Total structure area: 360
- Total interior livable area: 360 sqft
Property
Features
- Levels: One
- Pool features: None
- Has view: Yes
- View description: Open
- Waterfront features: Pond, Creek
Lot
- Size: 53 Acres
- Features: Level
Details
- Parcel number: 015050044000
Construction
Type & style
- Home type: SingleFamily
- Property subtype: Single Family Residence
Materials
- T1-11
- Roof: Composition
Condition
- Year built: 2021
Utilities & green energy
- Electric: Public
- Water: Well
Community & HOA
HOA
- Has HOA: No
Location
- Region: Hayfork
Financial & listing details
- Price per square foot: $694/sqft
- Tax assessed value: $759,865
- Annual tax amount: $8,107
- Date on market: 9/26/2026
- Listing terms: Cash,Owner May Carry,Conventional
- Electric utility on property: Yes
- Road surface type: Dirt
Estimated market value
Not available
Estimated sales range
Not available
$1,123/mo
Price history
| Date | Event | Price |
|---|---|---|
| 9/26/2026 | Listed for sale | $250,000-16.7%$694/sqft |
Source:  SMLS #26-5364 Report a problem | ||
| 7/10/2026 | Listing removed | $300,000$833/sqft |
Source: Trinity County AOR #2112650 Report a problem | ||
| 1/10/2026 | Listed for sale | $300,000-24.1%$833/sqft |
Source: Trinity County AOR #2112650 Report a problem | ||
| 11/11/2025 | Listing removed | $395,000$1,097/sqft |
Source: Trinity County AOR #2112650 Report a problem | ||
| 5/11/2025 | Listed for sale | $395,000-1%$1,097/sqft |
Source: Trinity County AOR #2112650 Report a problem | ||
| 2/4/2025 | Listing removed | $399,000$1,108/sqft |
Source: Trinity County AOR #2111878 Report a problem | ||
| 5/11/2024 | Listed for sale | $399,000$1,108/sqft |
Source: Trinity County AOR #2111878 Report a problem | ||
| 5/3/2024 | Listing removed | -- |
Source: Trinity County AOR #2111878 Report a problem | ||
| 10/12/2023 | Price change | $399,000-9.3%$1,108/sqft |
Source: Trinity County AOR #2111878 Report a problem | ||
| 6/14/2023 | Listed for sale | $440,000$1,222/sqft |
Source: Trinity County AOR #2111878 Report a problem | ||
| 5/30/2023 | Contingent | $440,000$1,222/sqft |
Source: Trinity County AOR #2111878 Report a problem | ||
| 5/11/2023 | Listed for sale | $440,000-36.9%$1,222/sqft |
Source: Trinity County AOR #2111878 Report a problem | ||
| 6/11/2021 | Sold | $697,281-7%$1,937/sqft |
Source: Public Record Report a problem | ||
| 10/27/2017 | Sold | $750,000+188.5%$2,083/sqft |
Source: Public Record Report a problem | ||
| 8/20/2013 | Sold | $260,000+126.1%$722/sqft |
Source: Public Record Report a problem | ||
| 2/13/2004 | Sold | $115,000$319/sqft |
Source: Public Record Report a problem | ||
Public tax history
| Year | Property taxes | Tax assessment |
|---|---|---|
| 2025 | $8,107 -2.9% | $759,865 +2% |
| 2024 | $8,353 +1.6% | $744,966 +2% |
| 2023 | $8,221 +2.1% | $730,360 +2% |
| 2022 | $8,053 -4.6% | $716,040 -12.2% |
| 2021 | $8,444 +1% | $815,927 +1.2% |
| 2020 | $8,360 | $805,897 +3.4% |
| 2019 | -- | $779,200 +3.9% |
| 2018 | $7,683 +156.5% | $750,000 +166.9% |
| 2017 | $2,995 +6.3% | $281,038 +4.4% |
| 2016 | $2,818 +1.5% | $269,238 +1.5% |
| 2015 | $2,775 +1.4% | $265,194 +2% |
| 2014 | $2,738 | $260,000 +99.2% |
| 2013 | -- | $130,500 |
| 2012 | -- | $130,500 +2% |
| 2011 | -- | $127,942 +1% |
| 2010 | -- | $126,666 -0.2% |
| 2009 | -- | $126,967 +2% |
| 2008 | -- | $124,478 +2% |
| 2007 | -- | $122,038 +2% |
| 2006 | -- | $119,646 +2% |
| 2005 | -- | $117,300 +241.7% |
| 2004 | -- | $34,333 +1.9% |
| 2003 | -- | $33,704 +2% |
| 2002 | -- | $33,044 +2% |
| 2001 | -- | $32,397 |
Find assessor info on the county website
Monthly payment
Est. payment