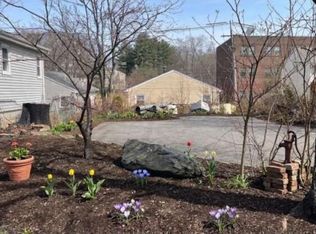
Excellent opportunity to build your dream home or next investment property! Vacant lot zoned for a single-family residence with a survey in hand. Conveniently located near local amenities, schools, shopping, and major highways. Buyer and/or buyer's agent to perform their own due diligence regarding zoning, permits, utilities, and all aspects of development and intended use. Don't miss this opportunity to secure a buildable lot in a desirable location. This lot can also be purchased together with the adjacent property referenced in MLS#1414779, offering an additional opportunity for expanded possibilities (buyer and/or buyer’s agent to perform their own due diligence regarding zoning, permits, utilities, and all aspects of development and intended use). Don't miss this opportunity to secure a buildable lot in a desirable location.
Under contract
$150,000
14 Seton St, Providence, RI 02909
--beds
0baths
6,398Square Feet
Unimproved Land
Built in ----
6,398 Square Feet Lot
$-- Zestimate®
$--/sqft
$-- HOA
What's special
- 16 days |
- 158 |
- 6 |
Zillow last checked:
Listing updated:
Listed by:
Guillermo Hurtado 508-493-9344,
RE/MAX ADVANTAGE GROUP
Source: StateWide MLS RI,MLS#: 1414763
Facts & features
Interior
Bedrooms & bathrooms
- Bathrooms: 0
Property
Lot
- Size: 6,398 Square Feet
- Features: Urban
- Topography: Open
Details
- Parcel number: PROVM115L95
- Zoning: R-1
- Zoning description: Residential
- Wooded area: 0
Utilities & green energy
- Water: Municipal, Public
- Utilities for property: Gas, Municipal Water, Electricity Available, Natural Gas Available
Community & HOA
Community
- Features: Near Public Transport, Commuter Bus, Highway Access, Hospital, Interstate, Public School, Restaurants, Schools
- Subdivision: Johnston Line
HOA
- Has HOA: No
Location
- Region: Providence
Financial & listing details
- Tax assessed value: $140,100
- Annual tax amount: $2,045
- Date on market: 6/11/2026
- Road surface type: Black Tar
Estimated market value
Not available
Estimated sales range
Not available
$1,989/mo
Price history
| Date | Event | Price |
|---|---|---|
| 6/26/2026 | Contingent | $150,000 |
Source: | ||
| 6/11/2026 | Listed for sale | $150,000-72.7% |
Source: | ||
| 12/23/2024 | Sold | $550,000+3.8% |
Source: | ||
| 10/22/2024 | Pending sale | $529,900 |
Source: | ||
| 10/9/2024 | Listed for sale | $529,900+657% |
Source: | ||
| 3/11/2024 | Listing removed | $70,000 |
Source: | ||
| 3/11/2024 | Pending sale | $70,000 |
Source: | ||
| 2/28/2024 | Price change | $70,000-17.6% |
Source: | ||
| 1/9/2024 | Listed for sale | $85,000+30.8% |
Source: | ||
| 1/10/2023 | Listing removed | -- |
Source: | ||
| 1/10/2023 | Listed for sale | $65,000 |
Source: | ||
| 12/14/2022 | Pending sale | $65,000 |
Source: | ||
| 12/1/2022 | Contingent | $65,000 |
Source: | ||
| 11/21/2022 | Price change | $65,000-13.3% |
Source: | ||
| 11/14/2022 | Listed for sale | $75,000+50% |
Source: | ||
| 5/2/2022 | Listing removed | -- |
Source: | ||
| 9/23/2021 | Listed for sale | $50,000-41.2% |
Source: | ||
| 10/12/2020 | Listing removed | $85,000 |
Source: Keller Williams Realty Leading #1265577 Report a problem | ||
| 10/5/2020 | Price change | $85,000-10.5% |
Source: Keller Williams Realty Leading #1265577 Report a problem | ||
| 9/24/2020 | Listed for sale | $95,000-65.5% |
Source: Keller Williams Realty Leading #1265577 Report a problem | ||
| 9/20/2018 | Sold | $275,000+77.4% |
Source: Public Record Report a problem | ||
| 9/22/2017 | Sold | $155,000+93.8% |
Source: Public Record Report a problem | ||
| 7/27/2017 | Sold | $80,000 |
Source: Public Record Report a problem | ||
Public tax history
| Year | Property taxes | Tax assessment |
|---|---|---|
| 2025 | $2,045 +151.5% | $140,100 +216.3% |
| 2024 | $813 +3% | $44,300 |
| 2023 | $789 | $44,300 |
| 2022 | $789 +20.3% | $44,300 +65.9% |
| 2021 | $656 +0% | $26,700 |
| 2020 | $656 | $26,700 |
| 2019 | $656 -10% | $26,700 +17.1% |
| 2018 | $729 0% | $22,800 |
| 2017 | $729 | $22,800 |
| 2016 | $729 -3.4% | $22,800 |
| 2015 | $755 -1.9% | $22,800 |
| 2013 | $770 -25.5% | $22,800 -29.6% |
| 2012 | $1,033 | $32,400 |
| 2011 | $1,033 +5% | $32,400 |
| 2010 | $984 -50.3% | $32,400 -60.4% |
| 2009 | $1,980 +6% | $81,800 |
| 2007 | $1,868 +90.2% | $81,800 +151.7% |
| 2006 | $982 | $32,500 |
| 2005 | $982 | $32,500 |
Find assessor info on the county website
Monthly payment
Estimated monthly payment$1,822
All calculations are estimates and provided by Zillow, Inc. for informational purposes only. Actual amounts may vary.
HOA fees may include property taxes on listings classified as Co-Ops. Contact the listing agent and/or owner for fee details.
Mortgage interest rates are dependent on a number of factors, including credit score, down payment, and repayment length. Interest rate data provided by Zillow Group Marketplace, Inc. as of 1/1/1970 from various mortgage lenders with which we have lead or other similar arrangements; the Estimated Payment is an average of those rates.
See how much you could borrow to make a competitive offer.
Climate risks
Neighborhood: Hartford
Getting around
35 / 100
Some TransitNearby schools
GreatSchools rating
- 3/10Anthony Carnevale Elementary SchoolGrades: PK-5Distance: 0.1 mi
- 2/10Governor Christopher Delsesto Middle SchoolGrades: 6-8Distance: 0.1 mi
- 2/10Mount Pleasant High SchoolGrades: 9-12Distance: 1.7 mi

A local agent can set up tours, give advice and negotiate with sellers.
A local lender can help you make sure your offer is ready when you are.


Nearby cities
Nearby neighborhoods
Nearby zip codes
Other Providence Topics
