Conveniently located in the heart of Los Angeles, this property offers easy access to major freeways, shopping, dining, and everyday amenities. Enjoy a central location with convenient access to nearby employment centers, entertainment, and public transportation. A great opportunity for buyers or investors seeking a property in an established Los Angeles neighborhood.
For sale
Listed by: Olsen Realty • Douglas Olsen • Contact: 949-533-0787
Price cut: $300K (10/23)
$1,478,000
1417 3rd Ave, Los Angeles, CA 90019
8beds
4,151sqft
Quadruplex
Built in 1907
-- sqft lot
$1,424,800 Zestimate®
$356/sqft
$-- HOA
What's special
- 10 days
- 122
- 4
Likely to sell faster than
Zillow last checked:
Listing updated:
Listed by:
Douglas Olsen DRE #01928821 949-533-0787,
Olsen Realty
Source: CRMLS,MLS#: OC26224031 Originating MLS: California Regional MLS
Facts & features
Interior
Bedrooms & bathrooms
- Bedrooms: 8
- Bathrooms: 8
- Full bathrooms: 8
- Main level bathrooms: 2
- Main level bedrooms: 2
Rooms
- Room types: Other
Cooling
- None
Appliances
- Laundry: Inside
Features
- Has fireplace: No
- Fireplace features: None
- Common walls with other units/homes: 1 Common Wall
Interior area
- Total interior livable area: 4,151 sqft
Property
Parking
- Total spaces: 4
- Parking features: Garage
- Garage spaces: 4
Features
- Levels: Two
- Stories: 2
- Entry location: 1
- Pool features: None
Lot
- Size: 7,002 Square Feet
- Features: 2-5 Units/Acre
Details
- Parcel number: 5072026015
- Special conditions: Standard
Construction
Type & style
- Home type: MultiFamily
- Property subtype: Quadruplex
- Attached to another structure: Yes
Condition
- New construction: No
- Year built: 1907
Utilities & green energy
- Sewer: Public Sewer
- Water: Public
Community & HOA
Community
- Features: Sidewalks
Location
- Region: Los Angeles
Financial & listing details
- Price per square foot: $356/sqft
- Tax assessed value: $1,200,000
- Date on market: 10/15/2026
- Cumulative days on market: 11 days
- Listing terms: Contract
Estimated market value
$1,424,800
$1.35M - $1.50M
$4,247/mo
Price history
| Date | Event | Price |
|---|---|---|
| 10/23/2026 | Price change | $1,478,000-16.9%$356/sqft |
Source:  CRMLS #OC26224031 Report a problem | ||
| 10/15/2026 | Listed for sale | $1,778,000+27.5%$428/sqft |
Source: CRMLS #OC26224031 Report a problem | ||
| 9/15/2021 | Sold | $1,395,000$336/sqft |
Source: Public Record Report a problem | ||
| 8/2/2021 | Contingent | $1,395,000$336/sqft |
Source:  SDMLS #SB21111502 Report a problem | ||
| 7/26/2021 | Listed for sale | $1,395,000$336/sqft |
Source: SDMLS #SB21111502 Report a problem | ||
| 7/26/2021 | Contingent | $1,395,000$336/sqft |
Source: CRMLS #SB21111502 Report a problem | ||
| 5/25/2021 | Listed for sale | $1,395,000+11.6%$336/sqft |
Source: CRMLS #SB21111502 Report a problem | ||
| 3/14/2017 | Sold | $1,250,000-3.5%$301/sqft |
Source:  CLAW #17197354 Report a problem | ||
| 2/20/2017 | Pending sale | $1,295,000$312/sqft |
Source: Keller Williams - Larchmont #17197354 Report a problem | ||
| 1/31/2017 | Listed for sale | $1,295,000+61.9%$312/sqft |
Source: Keller Williams Larchmont #17197354 Report a problem | ||
| 6/18/2013 | Sold | $800,000-5.9%$193/sqft |
Source: CLAW #13660313 Report a problem | ||
| 3/27/2013 | Listed for sale | $850,000-17.1%$205/sqft |
Source: RE/MAX Commercial & Investment #13660313 Report a problem | ||
| 10/19/2005 | Sold | $1,025,000+103.8%$247/sqft |
Source: Public Record Report a problem | ||
| 10/30/2003 | Sold | $503,000+64.8%$121/sqft |
Source: Public Record Report a problem | ||
| 7/13/2000 | Sold | $305,166+7.1%$74/sqft |
Source: Public Record Report a problem | ||
| 9/2/1999 | Sold | $285,000+90%$69/sqft |
Source: Public Record Report a problem | ||
| 12/17/1998 | Sold | $150,000$36/sqft |
Source: Public Record Report a problem | ||
Public tax history
| Year | Property taxes | Tax assessment |
|---|---|---|
| 2026 | -- | $1,200,000 -18.9% |
| 2025 | $18,284 +1.2% | $1,480,384 +2% |
| 2024 | $18,066 +1.9% | $1,451,358 +2% |
| 2023 | $17,724 +4.8% | $1,422,900 +2% |
| 2022 | $16,913 +3.3% | $1,395,000 +4.1% |
| 2021 | $16,370 -1% | $1,340,252 +1% |
| 2020 | $16,535 | $1,326,510 +2% |
| 2019 | $16,535 +5.1% | $1,300,500 +2% |
| 2018 | $15,736 | $1,275,000 +50.9% |
| 2017 | $15,736 +48.9% | $844,994 +2% |
| 2016 | $10,568 +2.6% | $828,426 +1.5% |
| 2015 | $10,298 +0.9% | $815,984 +2% |
| 2014 | $10,207 | $800,000 +83.9% |
| 2012 | -- | $435,000 |
| 2011 | -- | $435,000 -39.6% |
| 2010 | -- | $720,000 -33.8% |
| 2009 | -- | $1,087,737 +2% |
| 2008 | -- | $1,066,410 +2% |
| 2007 | -- | $1,045,500 +2% |
| 2006 | -- | $1,025,000 +79.1% |
| 2005 | -- | $572,220 +4% |
| 2004 | -- | $550,000 +46.8% |
| 2003 | -- | $374,544 +2% |
| 2002 | -- | $367,200 +28.8% |
| 2000 | -- | $285,000 |
Find assessor info on the county website
Monthly payment
Est. payment
Payment breakdown
Explore the cost of this home by adjusting the details. Changes won't be saved.Climate risks
Neighborhood: Arlington Heights

Similar homes
- $1,449,0008 bd4 ba4.9k sqft1206 3rd Ave, Los Angeles, CA 90019For Sale
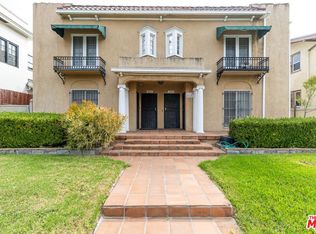 MLS ID #26837981, Paul Barbosa DRE # 01435896, Century 21 Hollywood. CLAW
- $1,290,0007 bd4 ba4.2k sqft1547 S Wilton Pl, Los Angeles, CA 90019For Sale
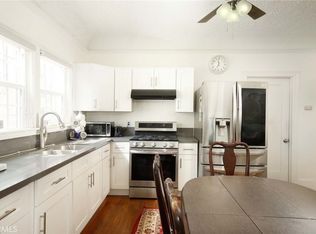 MLS ID #GD26221639, Vartan Markarian, Markarian Realty. CRMLS
- $1,350,0008 bd4 ba3.9k sqft1824 S Wilton Pl, Los Angeles, CA 90019For Sale
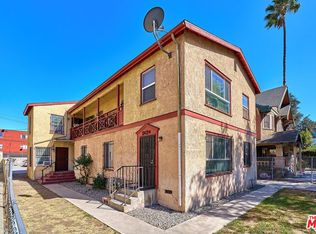 MLS ID #26862703, Peter Chang DRE # 02206804, First LA Asset Inc. CLAW
- $1,295,0008 bd4 ba3.6k sqft1690 West Blvd, Los Angeles, CA 90019For Sale
 MLS ID #26997353, Raaj Shankla DRE # 01721483, Estate Properties. CLAW
