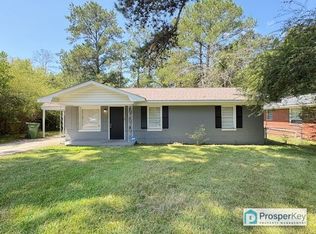
Don't miss this affordable, all-brick investment property, currently rented for $1,200 per month. Keep it as a long-term rental, convert it to a short-term rental or Airbnb, or make it your home. Conveniently located just minutes from Fort Benning and major highways, this property combines modern features, convenience, and investment potential.
For sale
$85,000
1434 John Smith Ave, Columbus, GA 31903
3beds
1,080sqft
Single Family Residence
Built in 1956
10,018 Square Feet Lot
$-- Zestimate®
$79/sqft
$-- HOA
What's special
All-brick investment propertyModern features
- 20 hours
- 114
- 14
Zillow last checked:
Listing updated:
Listed by:
Denzel Clements 706-507-0030,
Clements Realty LTD Co
Source: CBORGA,MLS#: 235305
Facts & features
Interior
Bedrooms & bathrooms
- Bedrooms: 3
- Bathrooms: 1
- Full bathrooms: 1
Interior area
- Total structure area: 1,080
- Total interior livable area: 1,080 sqft
Property
Lot
- Size: 10,018 Square Feet
Details
- Parcel number: 090 031 008
- Special conditions: Standard
Construction
Type & style
- Home type: SingleFamily
- Architectural style: Ranch
- Property subtype: Single Family Residence
Condition
- New construction: No
- Year built: 1956
Community & HOA
Community
- Security: None
- Subdivision: Booker Washington Heights
Location
- Region: Columbus
Financial & listing details
- Price per square foot: $79/sqft
- Tax assessed value: $63,990
- Annual tax amount: $1,002
- Date on market: 11/21/2026
Estimated market value
Not available
Estimated sales range
Not available
Not available
Price history
| Date | Event | Price |
|---|---|---|
| 11/21/2026 | Listed for sale | $85,000-19%$79/sqft |
Source:  CBORGA #235305 Report a problem | ||
| 4/6/2026 | Listing removed | $105,000$97/sqft |
Source: CBORGA #227820 Report a problem | ||
| 3/30/2026 | Price change | $105,000+5%$97/sqft |
Source: CBORGA #227820 Report a problem | ||
| 3/23/2026 | Price change | $99,995-7.4%$93/sqft |
Source: CBORGA #227820 Report a problem | ||
| 2/4/2026 | Listed for sale | $108,000-0.5%$100/sqft |
Source: CBORGA #227820 Report a problem | ||
| 12/3/2025 | Listing removed | $108,500$100/sqft |
Source: CBORGA #223891 Report a problem | ||
| 11/17/2025 | Price change | $108,500-1.4%$100/sqft |
Source: CBORGA #223891 Report a problem | ||
| 10/13/2025 | Listed for sale | $110,000+4.8%$102/sqft |
Source: CBORGA #223891 Report a problem | ||
| 7/16/2025 | Listing removed | $105,000$97/sqft |
Source: CBORGA #222016 Report a problem | ||
| 7/3/2025 | Listed for sale | $105,000+83.6%$97/sqft |
Source: CBORGA #222016 Report a problem | ||
| 5/13/2021 | Listing removed | -- |
Source: CBORGA Report a problem | ||
| 4/13/2021 | Pending sale | $57,200$53/sqft |
Source: CBORGA #183587 Report a problem | ||
| 3/29/2021 | Listing removed | -- |
Source: CBORGA Report a problem | ||
| 3/26/2021 | Listed for sale | $57,200$53/sqft |
Source: CBORGA #183587 Report a problem | ||
| 3/15/2021 | Listing removed | -- |
Source: CBORGA Report a problem | ||
| 3/9/2021 | Price change | $57,200-3.4%$53/sqft |
Source: Broadmoor Realty Company #183587 Report a problem | ||
| 2/15/2021 | Price change | $59,200+3.9%$55/sqft |
Source: Broadmoor Realty Company #183587 Report a problem | ||
| 2/4/2021 | Listed for sale | $57,000$53/sqft |
Source: Broadmoor Realty Company #183587 Report a problem | ||
Public tax history
| Year | Property taxes | Tax assessment |
|---|---|---|
| 2025 | $1,002 +0% | $25,596 |
| 2024 | $1,002 -0.6% | $25,596 |
| 2023 | $1,008 +16.1% | $25,596 +20.3% |
| 2022 | $868 +23.1% | $21,268 +23.1% |
| 2021 | $706 -94% | $17,280 |
| 2020 | $11,819 +19.7% | $17,280 |
| 2019 | $9,878 +48.7% | $17,280 |
| 2018 | $6,641 +838.1% | $17,280 |
| 2017 | $708 +209.3% | $17,280 +24.5% |
| 2016 | $229 | $13,874 |
| 2015 | $229 -0.1% | $13,874 |
| 2014 | $229 -0.1% | $13,874 |
| 2013 | $229 -60.1% | $13,874 |
| 2012 | $575 -0.1% | $13,874 |
| 2011 | $576 +21.2% | $13,874 |
| 2010 | $475 -17.6% | $13,874 |
| 2009 | $576 0% | -- |
| 2008 | $576 | -- |
| 2007 | $576 | $13,874 |
| 2006 | $576 | $13,874 |
| 2005 | $576 | $13,874 |
| 2004 | $576 | $13,874 |
| 2003 | -- | $13,874 |
| 2002 | -- | $13,874 |
| 2001 | -- | $13,874 |
| 2000 | -- | $13,874 |
Find assessor info on the county website
Monthly payment
Est. payment
Payment breakdown
Explore the cost of this home by adjusting the details. Changes won't be saved.Climate risks
Neighborhood: 31903
Similar homes
- $65,0003 bd1 ba1k sqft3936 Singer Dr, Columbus, GA 31903For Sale
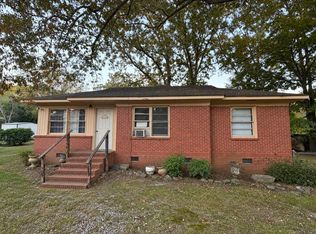
 MLS ID #235253, Tyler Ward, Coldwell Banker / Kennon, Parker, Duncan & Davis. CBORGA
- $89,9003 bd1 ba990 sqft53 Patton Dr, Columbus, GA 31903For Sale
 MLS ID #233360, Michael Campos, Keller Williams Realty River Cities. CBORGA
- $--3 bd1 ba900 sqft1524 Marrow Ave, Columbus, GA 31903Auction
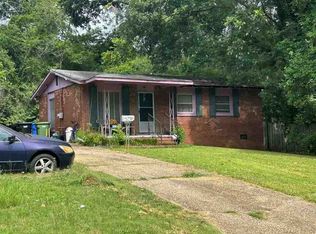 ServiceLink Auction
- $77,9103 bd1 ba1.1k sqft4213 Swann St, Columbus, GA 31903For Sale
 MLS ID #233925, Heather Rosales, Berkshire Hathaway HS First Magnolia Realty. CBORGA
- $88,0002 bd1 ba1k sqft125 Infantry Dr, Columbus, GA 31903For Sale
 MLS ID #7849780, KHANH NGUYEN, Homestar Realty Corporation. FMLS GA
- $89,9003 bd1 ba1.4k sqft3017 Plantation Rd, Columbus, GA 31903Active
 MLS ID #10877636, Tommy Allen Jr., Jason Mitchell Real Estate Georgia. GAMLS
- $88,0002 bd1 ba1k sqft20 Patch Dr, Columbus, GA 31903For SaleMLS ID #7849791, KHANH NGUYEN, Homestar Realty Corporation. FMLS GA
- $99,0003 bd1 ba1k sqft4210 Swann St, Columbus, GA 31903For SaleMLS ID #232881, Morgan Scarbrough, Coldwell Banker / Kennon, Parker, Duncan & Davis. CBORGA
- $84,0003 bd1 ba984 sqft4516 Sims St, Columbus, GA 31907For SaleMLS ID #233802, Richard Moore, AGC Living Company. CBORGA
- $89,0002 bd1 ba792 sqft1814 13th Ave, Columbus, GA 31901For SaleMLS ID #235214, Charmaine Crabb, Champions Realty. CBORGA
- $92,5003 bd2 ba1.1k sqft3537 Bondwood Dr, Columbus, GA 31906ActiveMLS ID #10867373, Jacqueline Fielder, RADIANT & Co. Realty. GAMLS
- $79,9993 bd2 ba1.4k sqft2611 Rice St, Columbus, GA 31903ActiveMLS ID #10708955, Kia Chambers, Prestige Property Brokers. GAMLS
- $112,0003 bd1 ba961 sqft184 30th Ave, Columbus, GA 31903For SaleMLS ID #232669, Arrio Granum, Coldwell Banker / Kennon, Parker, Duncan & Davis. CBORGA
- $94,9003 bd2 ba950 sqft4534 Evans St, Columbus, GA 31907For SaleMLS ID #233430, Holly Price, Haskin Realty Group, LLC. CBORGA
- $67,0003 bd1 ba1.3k sqft2533 Cornell Ave, Columbus, GA 31903For SaleMLS ID #233959, Jackie Leonard, 1st Class Real Estate Excellence. CBORGA
- $60,0003 bd2 ba1.1k sqft936 Calvin Ave, Columbus, GA 31903ActiveMLS ID #10880266, Misty Yeargan, BHHS Hodnett Cooper Real Estate. GAMLS
- $87,5002 bd2 ba1.1k sqft4312 Old Macon Rd APT 56, Columbus, GA 31907For SaleMLS ID #228113, Quintana Gibson, 1st Class Real Estate Excellence. CBORGA
