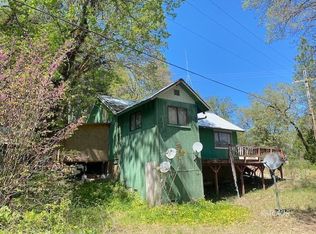
This is a 160 square foot, single family home. This home is located at 1489 Lower S Fork Rd, Hyampom, CA 96046.
Foreclosed
Est. $195,800
1489 Lower S Fork Rd, Hyampom, CA 96046
--beds
--baths
160sqft
SingleFamily
Built in 1964
3.8 Acres Lot
$195,800 Zestimate®
$1,224/sqft
$-- HOA
Overview
- 527 days |
- 14 |
- 3 |
Facts & features
Interior
Interior area
- Total interior livable area: 160 sqft
Property
Lot
- Size: 3.8 Acres
Details
- Parcel number: 011340027000
Construction
Type & style
- Home type: SingleFamily
Condition
- Year built: 1964
Community & HOA
Location
- Region: Hyampom
Financial & listing details
- Price per square foot: $1,224/sqft
- Tax assessed value: $296,514
- Annual tax amount: $3,140
Visit our professional directory to find a foreclosure specialist in your area that can help with your home search.
Find a foreclosure agentForeclosure details
Estimated market value
$195,800
$141,000 - $255,000
$1,537/mo
Price history
| Date | Event | Price |
|---|---|---|
| 1/7/2025 | Sold | $240,702+86.6%$1,504/sqft |
Source: Public Record Report a problem | ||
| 6/3/2004 | Sold | $129,000$806/sqft |
Source: Public Record Report a problem | ||
Public tax history
| Year | Property taxes | Tax assessment |
|---|---|---|
| 2025 | $3,140 -5.6% | $296,514 +2% |
| 2024 | $3,326 +6.1% | $290,700 +2.2% |
| 2023 | $3,134 -2.2% | $284,454 +2% |
| 2022 | $3,203 +13.5% | $278,878 +2% |
| 2021 | $2,823 +1.9% | $273,410 +1% |
| 2020 | $2,770 | $270,608 +2% |
| 2019 | -- | $265,302 +2% |
| 2018 | $2,626 +0.3% | $260,100 +2% |
| 2017 | $2,618 +54.6% | $255,000 +64.6% |
| 2016 | $1,693 +10.4% | $154,921 +1.5% |
| 2015 | $1,534 +1.4% | $152,595 +2% |
| 2014 | $1,512 | $149,607 +2.2% |
| 2013 | -- | $146,382 |
| 2012 | -- | $146,382 +2% |
| 2011 | -- | $143,512 +1% |
| 2010 | -- | $142,082 -0.2% |
| 2009 | -- | $142,421 +2% |
| 2008 | -- | $139,630 +2% |
| 2007 | -- | $136,894 +2% |
| 2006 | -- | $134,211 +2% |
| 2005 | -- | $131,580 +130% |
| 2004 | -- | $57,199 +1.9% |
| 2003 | -- | $56,151 +2% |
| 2002 | -- | $55,051 +2% |
| 2001 | -- | $53,972 |
Find assessor info on the county website
Monthly payment
Estimated monthly payment$1,822
All calculations are estimates and provided by Zillow, Inc. for informational purposes only. Actual amounts may vary.
HOA fees may include property taxes on listings classified as Co-Ops. Contact the listing agent and/or owner for fee details.
Mortgage interest rates are dependent on a number of factors, including credit score, down payment, and repayment length. Interest rate data provided by Zillow Group Marketplace, Inc. as of 1/1/1970 from various mortgage lenders with which we have lead or other similar arrangements; the Estimated Payment is an average of those rates.
See how much you could borrow to make a competitive offer.
Climate risks
Neighborhood: 96046
Getting around
0 / 100
Car-DependentNearby schools
GreatSchools rating
- 6/10Hayfork Valley Elementary SchoolGrades: K-8Distance: 15.1 mi
- 8/10Hayfork High SchoolGrades: 9-12Distance: 16 mi
- California
- Trinity County
- Hyampom
- 96046
- 1489 Lower S Fork Rd
Nearby cities
Nearby zip codes
Other Hyampom Topics
