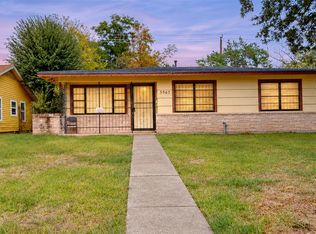
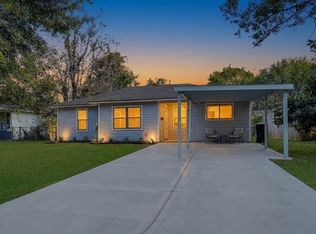
$195,500
-- bd1 ba981 sqft
1507 Stanton Dr, Alvin, TX 77511
Off Market
Likely to sell faster than
Zillow last checked:
Listing updated:
Luis Carbajal TREC #0725384 936-232-8752,
Orchard Brokerage

Not available
Estimated sales range
Not available
$1,652/mo
| Date | Event | Price |
|---|---|---|
| 10/30/2026 | Price change | $160,000-11.1%$139/sqft |
Source:  HAR #88741134 Report a problem | ||
| 10/26/2026 | Listed for sale | $180,000+0.1%$156/sqft |
Source: HAR #88741134 Report a problem | ||
| 2/25/2026 | Listing removed | $179,900$156/sqft |
Source: HAR #94311951 Report a problem | ||
| 2/17/2026 | Price change | $179,900-2.7%$156/sqft |
Source: HAR #94311951 Report a problem | ||
| 2/11/2026 | Price change | $184,900-2.7%$161/sqft |
Source: HAR #94311951 Report a problem | ||
| 1/27/2026 | Listed for sale | $190,000-7.3%$165/sqft |
Source: HAR #94311951 Report a problem | ||
| 12/31/2025 | Listing removed | $1,500$1/sqft |
Source:  HAR #61035982 Report a problem | ||
| 12/19/2025 | Listed for rent | $1,500-6.3%$1/sqft |
Source: HAR #61035982 Report a problem | ||
| 12/2/2025 | Listing removed | $1,600$1/sqft |
Source: HAR #60823923 Report a problem | ||
| 11/21/2025 | Price change | $1,600-5.9%$1/sqft |
Source: HAR #60823923 Report a problem | ||
| 11/14/2025 | Price change | $1,700-5.6%$1/sqft |
Source: HAR #60823923 Report a problem | ||
| 10/22/2025 | Listed for rent | $1,800$2/sqft |
Source: HAR #60823923 Report a problem | ||
| 8/28/2025 | Listing removed | $205,000$178/sqft |
Source: HAR #30132472 Report a problem | ||
| 7/1/2025 | Price change | $205,000+10.9%$178/sqft |
Source: HAR #30132472 Report a problem | ||
| 6/1/2025 | Listed for sale | $184,900$161/sqft |
Source: HAR #30132472 Report a problem | ||
| 4/11/2025 | Listing removed | $184,900$161/sqft |
Source: HAR #30132472 Report a problem | ||
| 1/29/2025 | Price change | $184,900-2.6%$161/sqft |
Source: HAR #30132472 Report a problem | ||
| 1/20/2025 | Price change | $189,900-2.6%$165/sqft |
Source: HAR #30132472 Report a problem | ||
| 1/17/2025 | Price change | $194,900-2.5%$169/sqft |
Source: HAR #30132472 Report a problem | ||
| 1/2/2025 | Listed for sale | $199,900+81.7%$174/sqft |
Source: HAR #30132472 Report a problem | ||
| 7/7/2024 | Listing removed | -- |
Source: HAR #51690068 Report a problem | ||
| 6/23/2024 | Price change | $110,000+22.2%$95/sqft |
Source: HAR #51690068 Report a problem | ||
| 6/20/2024 | Listed for sale | $90,000$78/sqft |
Source: HAR #51690068 Report a problem | ||
| Year | Property taxes | Tax assessment |
|---|---|---|
| 2025 | $2,983 | $121,940 +168.1% |
| 2024 | -- | $45,483 +10% |
| 2023 | -- | $41,348 +10% |
| 2022 | $439 -21.6% | $37,589 +10% |
| 2021 | $560 +18.1% | $34,172 +10% |
| 2020 | $474 +17.1% | $31,065 +10% |
| 2019 | $405 +38.1% | $28,241 -18.4% |
| 2018 | $293 | $34,590 +48.2% |
| 2017 | $293 -1.2% | $23,340 |
| 2016 | $297 | $23,340 +3.2% |
| 2015 | $297 | $22,610 +20% |
| 2014 | $297 | $18,840 -8.1% |
| 2012 | -- | $20,490 |
| 2011 | -- | $20,490 |
| 2010 | -- | $20,490 -3.4% |
| 2009 | -- | $21,220 +14% |
| 2008 | -- | $18,610 +3.9% |
| 2006 | -- | $17,910 +6.6% |
| 2005 | -- | $16,800 -0.7% |
| 2004 | -- | $16,920 +21.3% |
| 2003 | -- | $13,950 +1% |
| 2002 | -- | $13,810 |
| 2001 | -- | $13,810 |
Source: HAR. This data may not be complete. We recommend contacting the local school district to confirm school assignments for this home.
A local agent can set up tours, give advice and negotiate with sellers.