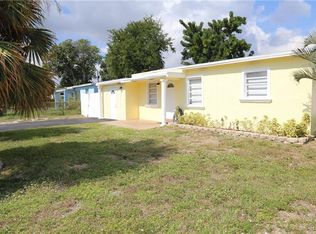
Investor special. CASH only. Seller is a corporation and has never occupied the home. Seller does not disclose. It is Buyer and Buyers brokers responsibility to verify all information and restrictions. NO HOA. Seller chooses title. Listing agent can not represent buyer. Closing term of on or before 45 days is requested by seller. Assume multiple offers!
For sale
$279,900
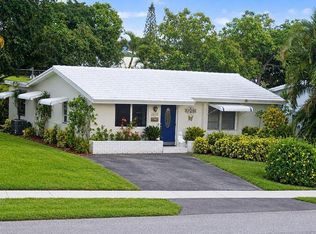
1513 NE 27TH Court, Pompano Beach, FL 33064
2beds
824sqft
Single Family Residence
Built in 1954
5,525 Square Feet Lot
$275,800 Zestimate®
$340/sqft
$-- HOA
What's special
- 6 days
- 466
- 34
Zillow last checked:
Listing updated:
Listed by:
Ryan R Sack LLC 813-351-9598,
Future Home Realty Inc
Source: BeachesMLS,MLS#: B26079374 Originating MLS: BeachesMLS
Facts & features
Interior
Bedrooms & bathrooms
- Bedrooms: 2
- Bathrooms: 1
- Full bathrooms: 1
- Main level bathrooms: 1
- Main level bedrooms: 2
Heating
- Central, Electric
Cooling
- Central Air
Features
- Bedroom on Main Level, High Ceilings
- Flooring: Tile
- Has fireplace: No
Interior area
- Total structure area: 1,344
- Total interior livable area: 824 sqft
Video & virtual tour
Property
Parking
- Total spaces: 2
- Parking features: Attached Carport, Attached, Carport, Driveway
- Carport spaces: 1
- Has uncovered spaces: Yes
- Details: CarportSpaces:1.00
Accessibility
- Accessibility features: None
Features
- Levels: One
- Stories: 1
- Fencing: Back Yard,Fenced
Lot
- Size: 5,525 Square Feet
- Features: < 1/4 Acre
Details
- Parcel number: 484224070530
- Zoning: RS-4
- Special conditions: Standard
Construction
Type & style
- Home type: SingleFamily
- Architectural style: Ranch
- Property subtype: Single Family Residence
Materials
- Concrete, Stucco
- Foundation: Slab
- Roof: Shingle
Condition
- Resale
- New construction: No
- Year built: 1954
Utilities & green energy
- Sewer: Public Sewer
- Water: Public
- Utilities for property: Electricity Connected, Water Available
Community & HOA
Community
- Security: Smoke Detector(s)
- Subdivision: COLLIER MANOR
HOA
- Has HOA: No
Location
- Region: Pompano Beach
Financial & listing details
- Price per square foot: $340/sqft
- Tax assessed value: $323,950
- Annual tax amount: $6,807
- Date on market: 10/13/2026
- Cumulative days on market: 13 days
- Listing terms: Cash
- Electric utility on property: Yes
- Road surface type: Concrete
Estimated market value
$275,800
$262,000 - $290,000
$2,506/mo
Price history
| Date | Event | Price |
|---|---|---|
| 10/13/2026 | Listed for sale | $279,900$340/sqft |
Source:  BeachesMLS #B26079374 Report a problem | ||
| 9/30/2026 | Pending sale | $279,900$340/sqft |
Source: BeachesMLS #B26079374 Report a problem | ||
| 9/22/2026 | Listed for sale | $279,900+309.2%$340/sqft |
Source: BeachesMLS #B26079374 Report a problem | ||
| 9/4/2026 | Listing removed | $2,190$3/sqft |
Source: Zillow Rentals Report a problem | ||
| 8/31/2026 | Price change | $2,190-2.4%$3/sqft |
Source: Zillow Rentals Report a problem | ||
| 8/21/2026 | Listed for rent | $2,245+52.2%$3/sqft |
Source: Zillow Rentals Report a problem | ||
| 7/9/2019 | Listing removed | $1,475$2/sqft |
Source: Zillow Rental Network Report a problem | ||
| 6/29/2019 | Price change | $1,475+0.4%$2/sqft |
Source: Zillow Rental Network Report a problem | ||
| 6/16/2019 | Listed for rent | $1,469-1.4%$2/sqft |
Source: Invitation Homes Report a problem | ||
| 7/3/2018 | Listing removed | $1,490$2/sqft |
Source: Invitation Homes Report a problem | ||
| 6/15/2018 | Price change | $1,490-2.3%$2/sqft |
Source: Invitation Homes Report a problem | ||
| 5/17/2018 | Price change | $1,525-1.3%$2/sqft |
Source: Invitation Homes Report a problem | ||
| 5/8/2018 | Price change | $1,545-2.8%$2/sqft |
Source: Invitation Homes Report a problem | ||
| 4/25/2018 | Price change | $1,590-2.2%$2/sqft |
Source: Invitation Homes Report a problem | ||
| 3/7/2018 | Listed for rent | $1,625+8.4%$2/sqft |
Source: Invitation Homes Report a problem | ||
| 5/5/2017 | Listing removed | $1,499$2/sqft |
Source: Waypoint Homes Report a problem | ||
| 5/4/2017 | Price change | $1,499-1.7%$2/sqft |
Source: Waypoint Homes Report a problem | ||
| 4/17/2017 | Price change | $1,525-4.6%$2/sqft |
Source: Waypoint Homes Report a problem | ||
| 3/24/2017 | Listed for rent | $1,599+10.3%$2/sqft |
Source: Waypoint Homes Report a problem | ||
| 12/14/2016 | Listing removed | $1,450+11.5%$2/sqft |
Source: Waypoint Homes Report a problem | ||
| 12/8/2015 | Listing removed | $1,300$2/sqft |
Source: Real Estate Sales Force Report a problem | ||
| 11/18/2015 | Price change | $1,300-1.9%$2/sqft |
Source: Real Estate Sales Force Report a problem | ||
| 11/4/2015 | Listed for rent | $1,325+2.8%$2/sqft |
Source: Waypoint Homes Report a problem | ||
| 9/30/2015 | Listing removed | $1,289$2/sqft |
Source: Real Estate Sales Force Report a problem | ||
| 9/26/2015 | Listed for rent | $1,289$2/sqft |
Source: Real Estate Sales Force Report a problem | ||
| 12/27/2012 | Sold | $68,400+143.4%$83/sqft |
Source: Public Record Report a problem | ||
| 10/8/2009 | Sold | $28,100-63.5%$34/sqft |
Source: Public Record Report a problem | ||
| 4/25/2003 | Sold | $77,000+10%$93/sqft |
Source: Public Record Report a problem | ||
| 3/23/2000 | Sold | $70,000+35.1%$85/sqft |
Source: Public Record Report a problem | ||
| 4/20/1998 | Sold | $51,800$63/sqft |
Source: Public Record Report a problem | ||
Public tax history
| Year | Property taxes | Tax assessment |
|---|---|---|
| 2025 | $6,599 +2.9% | $294,780 +10% |
| 2024 | $6,413 +16.4% | $267,990 +10% |
| 2023 | $5,510 +12.3% | $243,630 +10% |
| 2022 | $4,907 +12% | $221,490 +10% |
| 2021 | $4,380 +6.8% | $201,360 +5.4% |
| 2020 | $4,102 +7% | $190,990 +10% |
| 2019 | $3,833 | $173,630 +10% |
| 2018 | $3,833 +13% | $157,850 +39.6% |
| 2017 | $3,392 +36% | $113,040 +10% |
| 2016 | $2,494 +12.3% | $102,770 +10% |
| 2015 | $2,221 +66.2% | $93,430 +93% |
| 2014 | $1,336 | $48,410 +10% |
| 2013 | $1,336 +42.2% | $44,010 +15.1% |
| 2012 | $940 -23.5% | $38,250 -27.8% |
| 2011 | $1,229 -37% | $53,010 -38.9% |
| 2010 | $1,949 -36.1% | $86,790 -39.9% |
| 2009 | $3,053 -19% | $144,480 -23.6% |
| 2008 | $3,767 -4% | $189,180 -4.3% |
| 2007 | $3,925 +6.8% | $197,720 +17.3% |
| 2006 | $3,673 | $168,560 +63.2% |
| 2005 | -- | $103,270 +25.7% |
| 2004 | $2,035 +2% | $82,130 +3.9% |
| 2003 | $1,995 +12.7% | $79,050 +15.6% |
| 2002 | $1,770 +26.6% | $68,360 +26.4% |
| 2001 | $1,398 +1.6% | $54,080 |
| 2000 | $1,376 | -- |
Find assessor info on the county website
Monthly payment
Est. payment
Payment breakdown
Explore the cost of this home by adjusting the details. Changes won't be saved.Climate risks
Neighborhood: Cresthaven
Nearby schools
Schools provided by the listing agent
- Elementary: Cresthaven
- Middle: Crystal Lake
- High: Deerfield Beach
Source: BeachesMLS. This data may not be complete. We recommend contacting the local school district to confirm school assignments for this home.

Similar homes
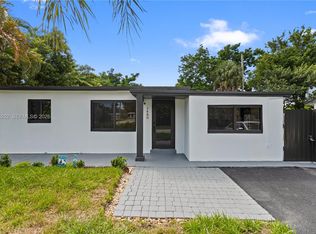
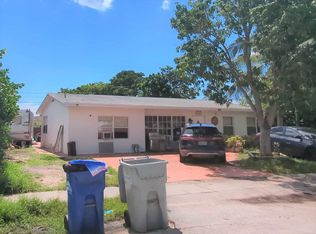
- $--3 bd2 ba1.1k sqft3160 NE 11th Ave, Pompano Beach, FL 33064Auction
 ServiceLink Auction
- $245,0002 bd1 ba884 sqft111 NW 25TH Court, Pompano Beach, FL 33064For Sale

 MLS ID #B26086294, Janet Denti, Balistreri Real Estate Inc. BeachesMLS
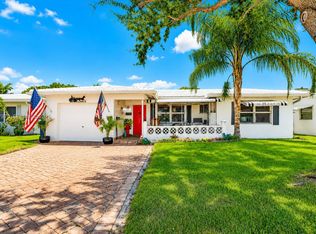
- $299,0002 bd2 ba1.2k sqftLeisureville First Sec, Pompano Beach, FL 33064For Sale
 MLS ID #A12047870, Fernando Alejandre, Canvas Real Estate. MIAMI
- $230,0002 bd1 ba1.1k sqft2670 E GOLF Boulevard, Pompano Beach, FL 33064For Sale
 MLS ID #B26085843, Jared Zecca, ZenQuest Realty Inc. BeachesMLS
- $250,0002 bd1 ba1k sqft2581 E Golf Boulevard, Pompano Beach, FL 33064For SaleMLS ID #B26031005, Laurel Cowen, Balistreri Real Estate Inc. BeachesMLS
- $265,0002 bd2 ba950 sqft1990 NE 33RD Street #3, Lighthouse Point, FL 33064For SaleMLS ID #B26082578, Jonathan Mark Phillips, Keller Williams Realty Service. BeachesMLS
- $365,0003 bd1 ba828 sqft4320 NE 18TH Avenue, Pompano Beach, FL 33064For SaleMLS ID #B26085320, Chaddler Williams, Balistreri Real Estate Inc. BeachesMLS
- $360,0002 bd2 ba624 sqft3141 NE 12th Avenue, Pompano Beach, FL 33064For SaleMLS ID #R11138931, Michael P Catino PA, Compass Florida LLC. BeachesMLS
- $279,0002 bd2 ba890 sqft2748 NE 28th Avenue #20, Lighthouse Point, FL 33064For SaleMLS ID #B26045211, Benjamin Stafford, Compass Florida, LLC. BeachesMLS
- $280,0002 bd2 ba980 sqft2731 NE 14TH ST Causeway #405, Pompano Beach, FL 33062For SaleMLS ID #B26066552, Candace Garber, TruDeals Realty Corp. BeachesMLS
- $298,0002 bd2 ba980 sqftSea Haven Condominium, Pompano Beach, FL 33062For SaleMLS ID #B26083122, Zygmunt Kurasz, LoKation. BeachesMLS
- $410,0003 bd1 ba902 sqft3261 NE 14th Avenue, Pompano Beach, FL 33064For SaleMLS ID #F10555409, Alessandra Senior, Coldwell Banker Realty. BeachesMLS
- $285,0001 bd2 ba982 sqftVoyager Condominium, Pompano Beach, FL 33062For SaleMLS ID #A12102186, Danny Shears, Coldwell Banker Realty. MIAMI
- $279,0002 bd2 ba980 sqft2731 NE 14th St Causeway #115, Pompano Beach, FL 33062For SaleMLS ID #B26039145, Julia da Silva, EXP Realty. BeachesMLS
- $155,0001 bd1 ba640 sqftHaven House, Pompano Beach, FL 33064For SaleMLS ID #B26064803, Duncan B MacEwan, Preview Properties, Inc. BeachesMLS
- $257,9001 bd1 ba632 sqft2311 NE 36th Street NE #2G, Lighthouse Point, FL 33064For SaleMLS ID #B26074127, Les R Stein, New Castle Realty Inc #1. BeachesMLS
- $289,0002 bd2 ba980 sqftSEA HAVEN, Pompano Beach, FL 33062For SaleMLS ID #B26015511, Raymond Paul PA, Raymond Paul Realty. BeachesMLS
- $250,0002 bd1 ba768 sqft1110 N Riverside Drive #12B, Pompano Beach, FL 33062For SaleMLS ID #B26064983, Giovina Napolitano, Velocity Realty, Inc.. BeachesMLS
- $350,0002 bd2 ba980 sqft2731 NE 14th Street Causeway #407, Pompano Beach, FL 33062For SaleMLS ID #B26087624, Raymond Paul PA, Raymond Paul Realty. BeachesMLS
- $236,5002 bd2 ba1k sqft2202 NE 36th Street #15, Lighthouse Point, FL 33064For SaleMLS ID #B26028766, Mark Friedlander, United Realty Group Inc. BeachesMLS
