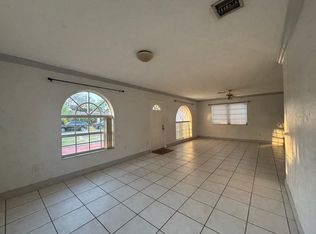
This 2092 square foot single family home has 3 bedrooms and 3.0 bathrooms. This home is located at 1525 Funston St, Hollywood, FL 33020.
Pre-foreclosure
Est. $717,100
1525 Funston St, Hollywood, FL 33020
3beds
3baths
2,092sqft
SingleFamily
Built in 1947
6,782 Square Feet Lot
$717,100 Zestimate®
$343/sqft
$-- HOA
Overview
- 25 days
- 29
- 1
Facts & features
Interior
Bedrooms & bathrooms
- Bedrooms: 3
- Bathrooms: 3
Heating
- Forced air, Other
Cooling
- None
Appliances
- Included: Dishwasher, Dryer, Garbage disposal, Refrigerator
- Laundry: In Unit
Features
- Flooring: Hardwood
Interior area
- Total interior livable area: 2,092 sqft
Property
Parking
- Total spaces: 1
- Parking features: None
Features
- Exterior features: Stucco, Cement / Concrete
Lot
- Size: 6,782 Square Feet
Details
- Parcel number: 514222240340
Construction
Type & style
- Home type: SingleFamily
Materials
- masonry
- Foundation: Other
- Roof: Other
Condition
- Year built: 1947
Community & HOA
Location
- Region: Hollywood
Financial & listing details
- Price per square foot: $343/sqft
- Tax assessed value: $771,500
- Annual tax amount: $14,544
Foreclosure details
Estimated market value
$717,100
$653,000 - $782,000
$4,873/mo
Price history
| Date | Event | Price |
|---|---|---|
| 9/20/2023 | Listing removed | -- |
Source: Zillow Rentals Report a problem | ||
| 7/28/2023 | Price change | $4,300-4.4%$2/sqft |
Source: Zillow Rentals Report a problem | ||
| 7/12/2023 | Listed for rent | $4,500+12.6%$2/sqft |
Source: Zillow Rentals Report a problem | ||
| 6/10/2022 | Listing removed | -- |
Source:  MIAMI #A11200837 Report a problem | ||
| 5/11/2022 | Listed for sale | $925,000+92.7%$442/sqft |
Source: MIAMI #A11200837 Report a problem | ||
| 2/21/2022 | Listing removed | -- |
Source: Zillow Rental Network_1 Report a problem | ||
| 2/16/2022 | Listed for rent | $3,995$2/sqft |
Source: Zillow Rental Network_1 Report a problem | ||
| 9/14/2021 | Listing removed | -- |
Source: Zillow Rental Network Premium Report a problem | ||
| 9/1/2021 | Listed for rent | $3,995$2/sqft |
Source: Zillow Rental Network Premium Report a problem | ||
| 6/1/2020 | Sold | $480,000-3.8%$229/sqft |
Source: MIAMI #A10712852 Report a problem | ||
| 5/14/2020 | Pending sale | $499,000$239/sqft |
Source: Blue Oak Equities LLC #A10712852 Report a problem | ||
| 10/22/2019 | Price change | $499,000-5%$239/sqft |
Source: Blue Oak Equities LLC #A10712852 Report a problem | ||
| 8/23/2019 | Listed for sale | $525,000+129.5%$251/sqft |
Source: Blue Oak Equities LLC #A10712852 Report a problem | ||
| 6/3/2015 | Sold | $228,800+1.7%$109/sqft |
Source: Public Record Report a problem | ||
| 4/15/2015 | Pending sale | $224,900$108/sqft |
Source: Homepath #F1313899 Report a problem | ||
| 4/15/2015 | Listed for sale | $224,900$108/sqft |
Source: Homepath #F1313899 Report a problem | ||
| 2/3/2015 | Listing removed | $224,900$108/sqft |
Source: Abbotoni & Associates R E Inc #F1313899 Report a problem | ||
| 1/28/2015 | Price change | $224,900-4.3%$108/sqft |
Source: Abbotoni & Associates R E Inc #F1313899 Report a problem | ||
| 1/24/2015 | Price change | $234,900-20.3%$112/sqft |
Source: Abbotoni & Associates R E Inc #F1313899 Report a problem | ||
| 1/22/2015 | Price change | $294,900+25.5%$141/sqft |
Source: RE/MAX Executive Realty Report a problem | ||
| 12/11/2014 | Listed for sale | $234,900-7.8%$112/sqft |
Source: Abbotoni & Associates R E Inc #F1313899 Report a problem | ||
| 6/7/2014 | Price change | $254,900-3.8%$122/sqft |
Source: Re/Max Executive Realty #A1909046 Report a problem | ||
| 5/23/2014 | Price change | $264,900-3.6%$127/sqft |
Source: Re/Max Executive Realty #A1909046 Report a problem | ||
| 4/27/2014 | Listed for sale | $274,900+43%$131/sqft |
Source: Re/Max Executive Realty #A1909046 Report a problem | ||
| 6/6/2013 | Sold | $192,300+92.3%$92/sqft |
Source: Public Record Report a problem | ||
| 10/18/1993 | Sold | $100,000$48/sqft |
Source: Public Record Report a problem | ||
Public tax history
| Year | Property taxes | Tax assessment |
|---|---|---|
| 2025 | $14,544 +1.4% | $637,350 +10% |
| 2024 | $14,336 +6.1% | $579,410 +10% |
| 2023 | $13,511 +29.5% | $526,740 +10% |
| 2022 | $10,431 +11% | $478,860 +10% |
| 2021 | $9,398 +37% | $435,330 +38.9% |
| 2020 | $6,860 +65.2% | $313,440 +39.9% |
| 2019 | $4,153 | $224,050 +1.9% |
| 2018 | $4,153 +4.7% | $219,880 +2.1% |
| 2017 | $3,966 +3.3% | $215,360 +2.1% |
| 2016 | $3,839 +0.3% | $210,940 -27.7% |
| 2015 | $3,827 -42.4% | $291,720 |
| 2014 | $6,643 | $291,720 +21.5% |
| 2013 | $6,643 +418% | $240,150 +5% |
| 2012 | $1,282 +4.1% | $228,750 +17.8% |
| 2011 | $1,232 +4.1% | $194,210 +124% |
| 2010 | $1,184 +9% | $86,710 +2.7% |
| 2009 | $1,086 +7.3% | $84,440 +0.1% |
| 2008 | $1,012 -22.6% | $84,360 +3% |
| 2007 | $1,308 -6.3% | $81,910 +2.5% |
| 2006 | $1,396 | $79,920 +3% |
| 2005 | -- | $77,600 +3% |
| 2004 | $1,349 +1% | $75,340 +1.9% |
| 2003 | $1,335 +3.4% | $73,940 +2.4% |
| 2002 | $1,291 +3% | $72,210 +1.6% |
| 2001 | $1,253 +6% | $71,080 |
| 2000 | $1,182 | -- |
Find assessor info on the county website
Monthly payment
Climate risks
Neighborhood: Hollywood Lakes

Similar homes
- $719,0002 bd1 ba1.2k sqftSunset Trails, Hollywood, FL 33020For Sale
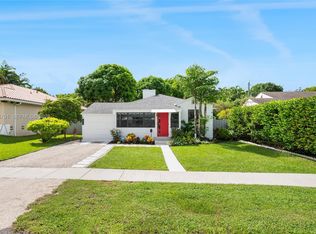
 MLS ID #A12114791, Alejandro Bruno, RE/MAX 5 Star Realty. MIAMI
- $699,9004 bd3 ba1.8k sqftHollywood, Hollywood, FL 33020For Sale
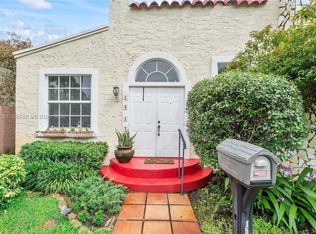 MLS ID #A12092201, Lucy Zuzulo-Miccio, Coldwell Banker Realty. MIAMI
- $679,0003 bd2 ba1.7k sqftHollywood, Hollywood, FL 33020For Sale
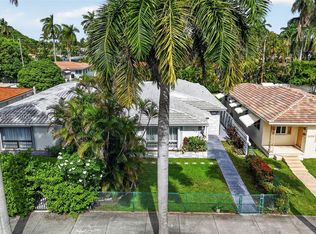 MLS ID #A12092766, Nicole Miller PA, Realty 100. MIAMI
- $649,0003 bd3 ba1.5k sqftHollywood, Hollywood, FL 33020For Sale
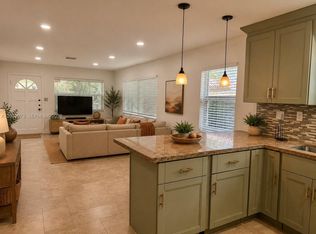 MLS ID #A12082073, Alejandro Bruno, RE/MAX 5 Star Realty. MIAMI
- $709,0003 bd3 ba1.8k sqftHollywood South Side Add, Hollywood, FL 33020For SaleMLS ID #A12065586, Joseph Brikman, Real Broker, LLC. MIAMI
- $680,0003 bd1 ba1.3k sqft1107 S 15th Avenue, Hollywood, FL 33020For Sale
 MLS ID #B26019842, Gabriella S Urso, Alto Realty Inc. BeachesMLS
- $695,0003 bd2 ba1.3k sqftHollywood View, Hollywood, FL 33020For SaleMLS ID #A12070006, Hermel Valenzuela Nunez, Luxe Properties. MIAMI
- $655,0003 bd2 ba1.3k sqftHollywood, Hollywood, FL 33020For SaleMLS ID #A12096066, Adam Chauser, Miles Goldstein Real Estate. MIAMI
- $695,0005 bd3 ba1.5k sqftSunset Trails No 4, Hollywood, FL 33020For SaleMLS ID #A12106120, Phillip Guerrero, First Premier Realty Corp.. MIAMI
- $570,0003 bd2 ba1.5k sqft1603 Jefferson Street, Hollywood, FL 33020For SaleMLS ID #B26027346, Agne Treciokiene, APRO & Associates LLC. BeachesMLS
- $759,0003 bd3 ba1.6k sqftSunset Trails No 5, Hollywood, FL 33020For SaleMLS ID #A12060518, Laura Rivero, Coldwell Banker Realty. MIAMI
- $654,5003 bd2 ba1.3k sqftHollywood Little Ranches, Hollywood, FL 33020For SaleMLS ID #A12079183, Jennifer Tijerino, Real Estate Sales Force. MIAMI
- $655,0003 bd3 ba1.6k sqftHollywood, Hollywood, FL 33020For SaleMLS ID #A11796921, Christina Maguire, Coldwell Banker Realty. MIAMI
- $849,0002 bd2 ba1.4k sqftHollywood, Hollywood, FL 33020For SaleMLS ID #A12111312, Alejandro Bruno, RE/MAX 5 Star Realty. MIAMI
- $835,0003 bd2 ba1.4k sqft1555 MONROE Street, Hollywood, FL 33020For SaleMLS ID #B26070082, Ann E McQueen, Compass Florida, LLC. BeachesMLS
- $599,0004 bd3 ba1.8k sqft2227 WILEY Court, Hollywood, FL 33020For SaleMLS ID #B26068388, John Leto Jr, RE/MAX Allstars. BeachesMLS
- $749,0003 bd1 ba1.3k sqftAtlantic Shores Dixie Hig, Hallandale, FL 33009For SaleMLS ID #A12099735, Fernando Amarante, Coldwell Banker Realty. MIAMI
- $1,049,0003 bd3 ba1.7k sqft1519 Washington Street, Hollywood, FL 33020For SaleMLS ID #B26067151, Anthony M Romero, Liv Signature Real Estate LLC. BeachesMLS
- $570,0003 bd2 ba1.2k sqftSunset Trails No 4, Hollywood, FL 33020For SaleMLS ID #A12095982, Christian Redondo, Nunu Realty, LLC.. MIAMI
